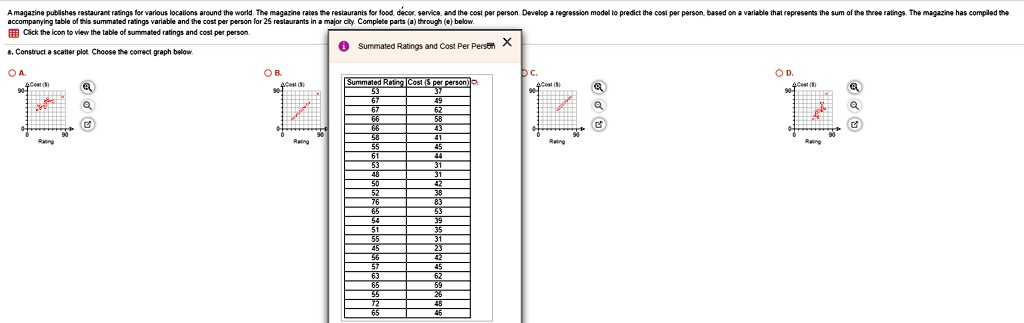
A magazine publishes restaurant ratings for various locations around the world. The magazine rates the restaurants for food, decor, service, and the cost per person. Develop a regression model to predict the cost per person, based on a variable that represents the sum of the three ratings. The magazine has compiled the accompanying table of this summated ratings variable and the cost per person for 25 restaurants in a major city. Complete parts (a) through (e) below.
Click the icon to view the table of summated ratings and cost per person.
8. Construct a scatter plot. Choose the correct graph below.
Summated Rating | Cost ($ per person)
53 | 37
67 | 49
67 | 62
66 | 58
66 | 43
58 | 41
55 | 44
61 | 45
48 | 31
53 | 31
50 | 42
52 | 38
76 | 63
65 | 39
54 | 53
51 | 31
55 | 35
45 | 23
56 | 42
57 | 45
63 | 62
65 | 59
72 | 48
55 | 26
65 | 46