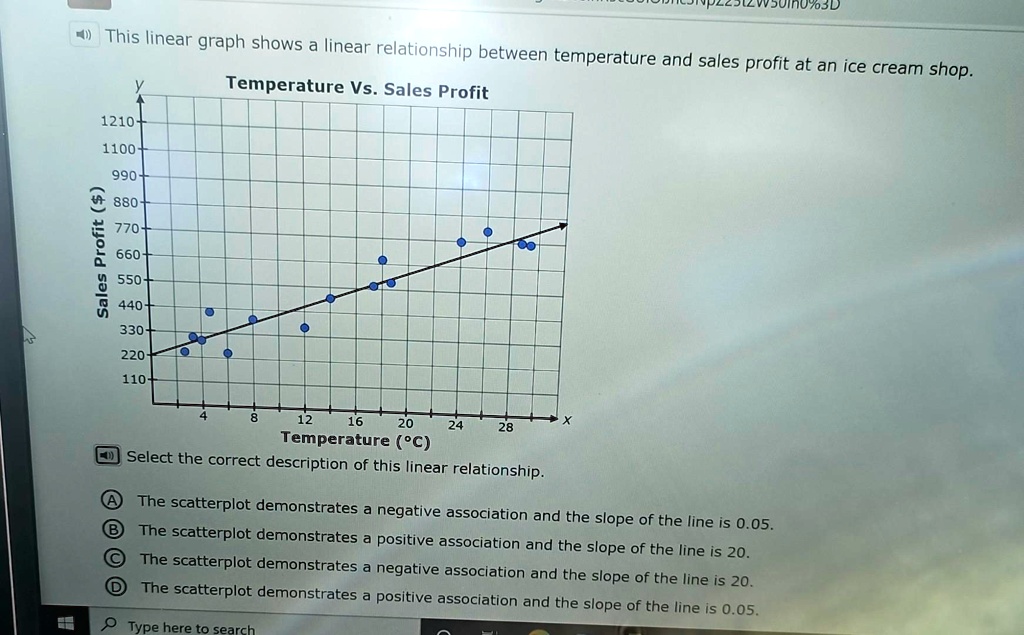
This linear graph shows a linear relationship between temperature and sales profit at an ice cream shop.
Temperature Vs. Sales Profit
Sales Profit ($)
Temperature (°C)
Select the correct description of this linear relationship.
? The scatterplot demonstrates a negative association and the slope of the line is 0.05.
? The scatterplot demonstrates a positive association and the slope of the line is 20.
? The scatterplot demonstrates a negative association and the slope of the line is 20.
? The scatterplot demonstrates a positive association and the slope of the line is 0.05.