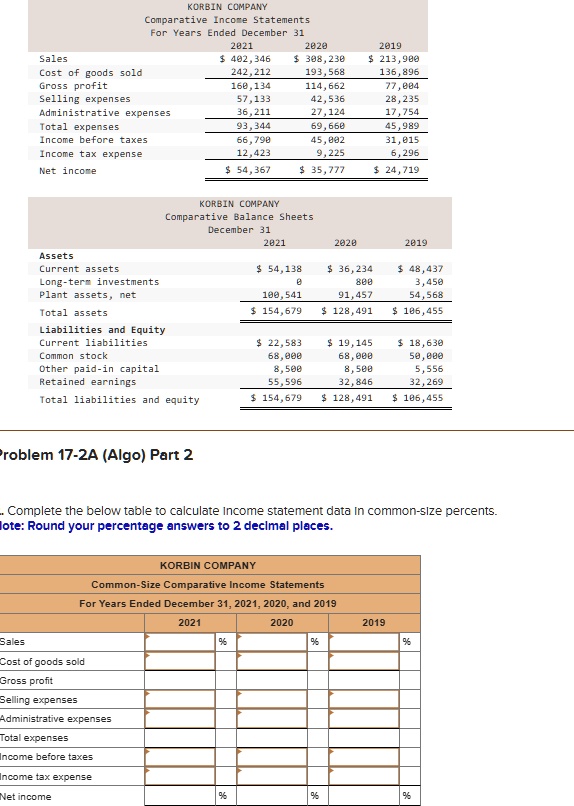
KORBIN COMPANY
Comparative Income Statements
For Years Ended December 31
2021 2020 2019
Sales $ 402,346 $ 308,230 $ 213,900
Cost of goods sold 242,212 193,568 136,896
Gross profit 160,134 114,662 77,004
Selling expenses 57,133 42,536 28,235
Administrative expenses 36,211 27,124 17,754
Total expenses 93,344 69,660 45,989
Income before taxes 66,790 45,002 31,015
Income tax expense 12,423 9,225 6,296
Net income $ 54,367 $ 35,777 $ 24,719
KORBIN COMPANY
Comparative Balance Sheets
December 31
2021 2020 2019
Assets
Current assets $ 54,138 $ 36,234 $ 48,437
Long-term investments 0 800 3,450
Plant assets, net 100,541 91,457 54,568
Total assets $ 154,679 $ 128,491 $ 106,455
Liabilities and Equity
Current liabilities $ 22,583 $ 19,145 $ 18,630
Common stock 68,000 68,000 50,000
Other paid-in capital 8,500 8,500 5,556
Retained earnings 55,596 32,846 32,269
Total liabilities and equity $ 154,679 $ 128,491 $ 106,455
Problem 17-2A (Algo) Part 2
.. Complete the below table to calculate Income statement data in common-size percents.
Note: Round your percentage answers to 2 decimal places.
KORBIN COMPANY
Common-Size Comparative Income Statements
For Years Ended December 31, 2021, 2020, and 2019
Sales 2021 % 2020 % 2019 %
Cost of goods sold
Gross profit
Selling expenses
Administrative expenses
Total expenses
Income before taxes
Income tax expense
Net income