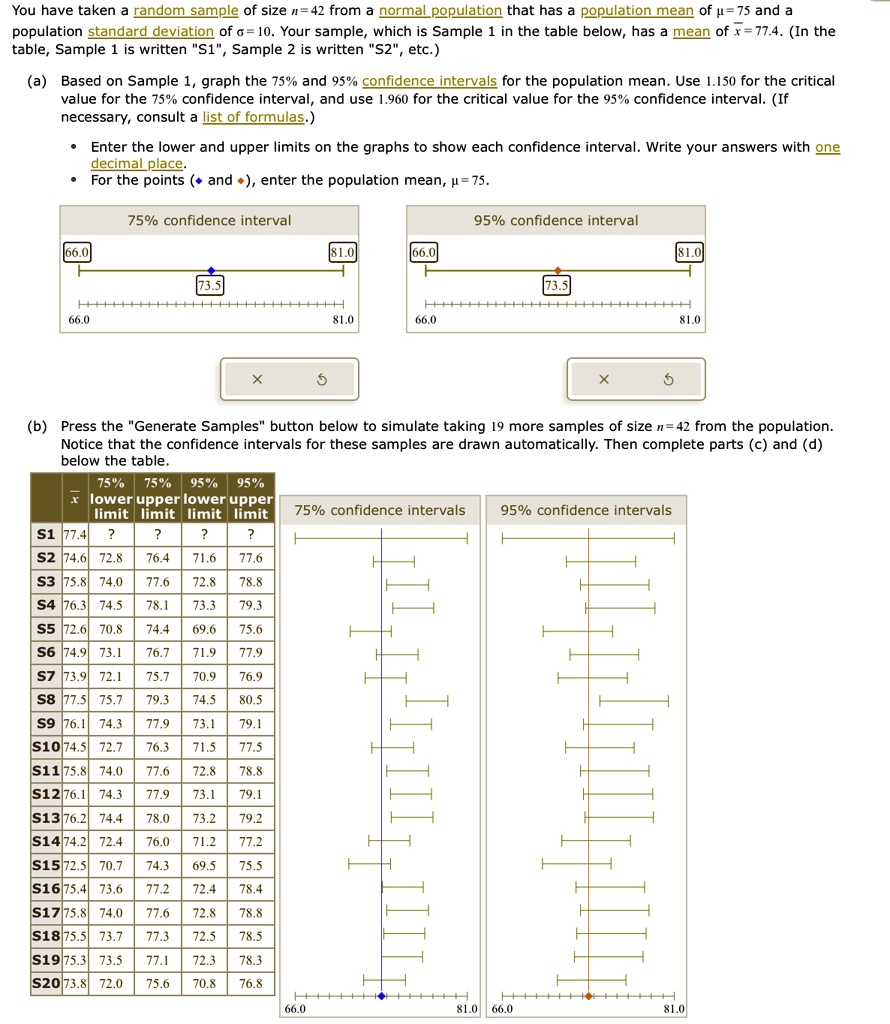
You have taken a random sample of size n = 42 from a normal population that has a population mean of ? = 75 and a population standard deviation of ? = 10. Your sample, which is Sample 1 in the table below, has a mean of x? = 77.4. (In the table, Sample 1 is written "S1", Sample 2 is written "S2", etc.)
(a) Based on Sample 1, graph the 75% and 95% confidence intervals for the population mean. Use 1.150 for the critical value for the 75% confidence interval, and use 1.960 for the critical value for the 95% confidence interval. (If necessary, consult a list of formulas.)
• Enter the lower and upper limits on the graphs to show each confidence interval. Write your answers with one decimal place.
• For the points (? and ?), enter the population mean, ? = 75.
75% confidence interval
66.0 81.0
73.5
66.0 81.0
95% confidence interval
66.0 81.0
73.5
66.0 81.0
(b) Press the "Generate Samples" button below to simulate taking 19 more samples of size n = 42 from the population. Notice that the confidence intervals for these samples are drawn automatically. Then complete parts (c) and (d) below the table.
x?
75%
lower
limit
75%
upper
limit
95%
lower
limit
95%
upper
limit
S1 77.4 ? ? ? ?
S2 74.6 72.8 76.4 71.6 77.6
S3 75.8 74.0 77.6 72.8 78.8
S4 76.3 74.5 78.1 73.3 79.3
S5 72.6 70.8 74.4 69.6 75.6
S6 74.9 73.1 76.7 71.9 77.9
S7 73.9 72.1 75.7 70.9 76.9
S8 77.5 75.7 79.3 74.5 80.5
S9 76.1 74.3 77.9 73.1 79.1
S10 74.5 72.7 76.3 71.5 77.5
S11 75.8 74.0 77.6 72.8 78.8
S12 76.1 74.3 77.9 73.1 79.1
S13 76.2 74.4 78.0 73.2 79.2
S14 74.2 72.4 76.0 71.2 77.2
S15 72.5 70.7 74.3 69.5 75.5
S16 75.4 73.6 77.2 72.4 78.4
S17 75.8 74.0 77.6 72.8 78.8
S18 75.5 73.7 77.3 72.5 78.5
S19 75.3 73.5 77.1 72.3 78.3
S20 73.8 72.0 75.6 70.8 76.8
75% confidence intervals
66.0 81.0
95% confidence intervals
66.0 81.0