It is known that GDP growth is negatively correlated with the change in unemployment rate.
Consider the U.S. quarterly real GDP and unemployment rate from 1948 to 2008. Let Y be
the growth rate of the GDP, and X be the change in unempolyment rate. Use the attached
R outputs to answer the following questions.
1. Write down the fitted linear regression model based on the summary outputs of m?.
Compute the associated t statistics for the estimated intercept ($\beta_0$) and slope ($\beta_1$) of the
f fitted regression model. Based on these t statistics, are these two coefficients significantly
different from zero and why?
2. Judging from the Box test, is such a linear regression adequate? Why?
3. To take care of the serial correlations in the residuals, a regression model with time series
error is built. Write down the fitted regression with time series error model.
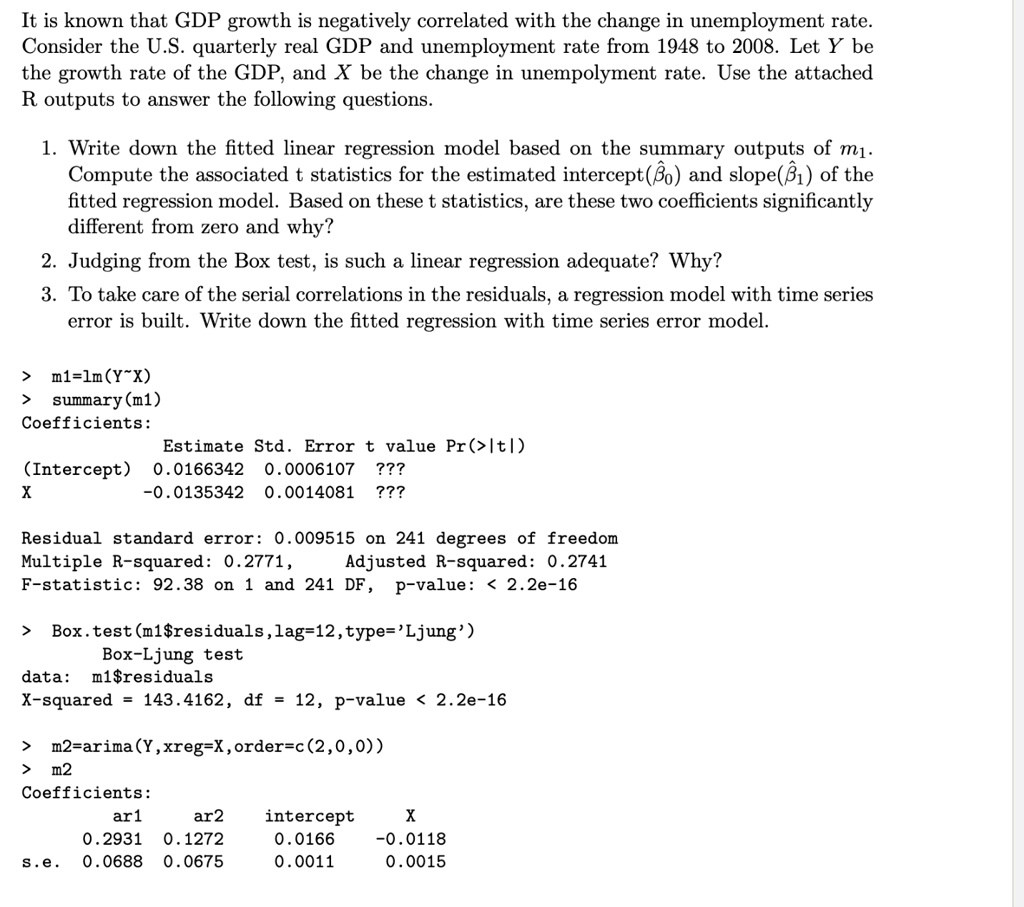
> m1=lm(Y~X)
>
summary(m1)
Coefficients:
Estimate Std. Error t value Pr(>|t|)
(Intercept) 0.0166342 0.0006107 ???
X -0.0135342 0.0014081 ???
Residual standard error: 0.009515 on 241 degrees of freedom
Multiple R-squared: 0.2771, Adjusted R-squared: 0.2741
F-statistic: 92.38 on 1 and 241 DF, p-value: < 2.2e-16
>
Box.test(m1$residuals, lag=12, type='Ljung')
Box-Ljung test
data: m1$residuals
X-squared = 143.4162, df = 12, p-value < 2.2e-16
> m2=arima(Y,xreg=X,order=c(2,0,0))
> m2
Coefficients:
ar1 ar2 intercept X
0.2931 0.1272 0.0166 -0.0118
s.e. 0.0688 0.0675 0.0011 0.0015