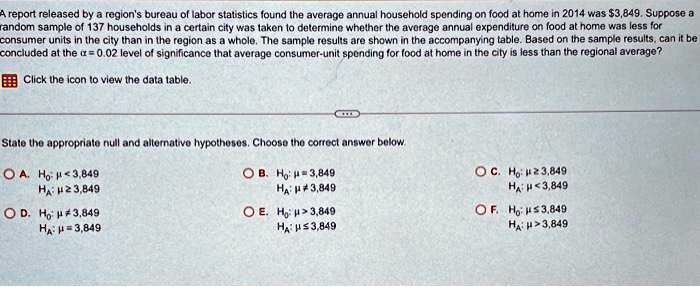
A report released by a region's bureau of labor statistics found the average annual household spending on food at home in 2014 was $3,849. Suppose a
random sample of 137 households in a certain city was taken to determine whether the average annual expenditure on food at home was less for
consumer units in the city than in the region as a whole. The sample results are shown in the accompanying table. Based on the sample results, can it be
concluded at the $\alpha = 0.02$ level of significance that average consumer-unit spending for food at home in the city is less than the regional average?
Click the icon to view the data table.
State the appropriate null and alternative hypotheses. Choose the correct answer below.
$\bigcirc$ A. $H_0: \mu \leq 3,849$
$H_A: \mu \geq 3,849$
$\bigcirc$ D. $H_0: \mu \neq 3,849$
$H_A: \mu = 3,849$
$\bigcirc$ B. $H_0: \mu = 3,849$
$H_A: \mu \neq 3,849$
$\bigcirc$ E. $H_0: \mu > 3,849$
$H_A: \mu \leq 3,849$
$\bigcirc$ C. $H_0: \mu \geq 3,849$
$H_A: \mu < 3,849$
$\bigcirc$ F. $H_0: \mu \leq 3,849$
$H_A: \mu > 3,849$