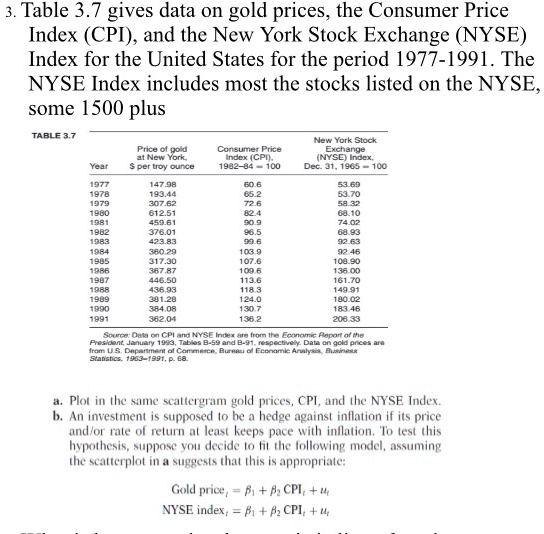
Table 3.7 gives data on gold prices, the Consumer Price Index (CPI), and the New York Stock Exchange (NYSE) Index for the United States for the period 1977-1991. The NYSE Index includes most of the stocks listed on the NYSE, totaling 1500 plus.
TABLE 3.7
Price of gold at New York, $ per troy ounce
New York Stock Exchange NYSE Index Dec. 31, 1965 = 100
Consumer Price Index (CPI), 1982-1984 = 100
Year 1977 1978 1979 1980 1981 1982 1983 1984 1985 1986 1987 1988 1989 1990 1991
147.98 193.44 307.62 612.51 459.61 376.01 423.83 360.29 317.30 367.87 446.50 436.93 381.28 384.08 362.04
60.6 65.2 72.6 82.4 90.9 96.5 99.6 103.9 107.6 109.6 113.6 118.3 124.0 130.7 136.2
53.69 53.70 58.32 68.10 74.02 68.93 92.63 92.46 108.90 136.00 161.70 149.91 180.02 183.46 206.33
Source: Data on CPI and NYSE Index are from the Economic Report of the President, January 1993, Tables B-59 and B-91, respectively. Data on gold prices are from U.S. Department of Commerce, Bureau of Economic Analysis, Business Statistics, 1963-1991, p.68.
a. Plot in the same scattergram gold prices, CPI, and the NYSE Index.
b. An investment is supposed to be a hedge against inflation if its price and/or rate of return at least keeps pace with inflation. To test this hypothesis, suppose you decide to fit the following model, assuming the scatterplot in a suggests that this is appropriate:
Gold price = α + βCPI + γNYSE index + u