PROBLEM DESCRIPTION
Consider daily (either 28 or 30 days) carbon dioxide (CO2) data from a green house in unit of parts-
per-million (ppm), for every month of January to December for the past three years (ie. 2018 and
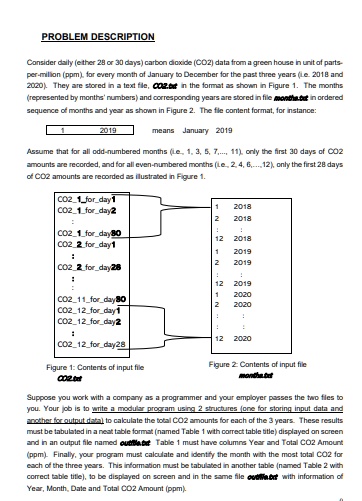
2020). They are stored in a text file, $CO_2.txt$ in the format as shown in Figure 1. The months
(represented by months' numbers) and corresponding years are stored in file $months.txt$ in ordered
sequence of months and year as shown in Figure 2. The file content format, for instance:
1
2019
means January 2019
Assume that for all odd-numbered months (ie, 1, 3, 5, 7,.... 11), only the first 30 days of CO2
amounts are recorded, and for all even-numbered months (ie, 2, 4, 6.....12), only the first 28 days
of CO2 amounts are recorded as illustrated in Figure 1.
$CO_2$_1_for_day1
$CO_2$_1_for_day2
1
2018
2
2018
$CO_2$_1_for_day30
$CO_2$_2_for_day1
...
12
2018
1
2019
$CO_2$_2_for_day28
...
2
2019
...
12
2019
1
2020
$CO_2$_{11}_for_day30
$CO_2$_{12}_for_day1
2
2020
...
$CO_2$_{12}_for_day2
12
2020
$CO_2$_{12}_for_day28
Figure 1: Contents of input file
$CO_2.txt$
Figure 2: Contents of input file
$months.txt$
Suppose you work with a company as a programmer and your employer passes the two files to
you. Your job is to write a modular program using 2 structures (one for storing input data and
another for output data) to calculate the total CO2 amounts for each of the 3 years. These results
must be tabulated in a neat table format (named Table 1 with correct table title) displayed on screen
and in an output file named $outfile.txt$. Table 1 must have columns Year and Total CO2 Amount
(ppm). Finally, your program must calculate and identify the month with the most total CO2 for
each of the three years. This information must be tabulated in another table (named Table 2 with
correct table title), to be displayed on screen and in the same file $outfile.txt$ with information of
Year, Month, Date and Total CO2 Amount (ppm).