Help me please interpret these graphs and results of case 1:
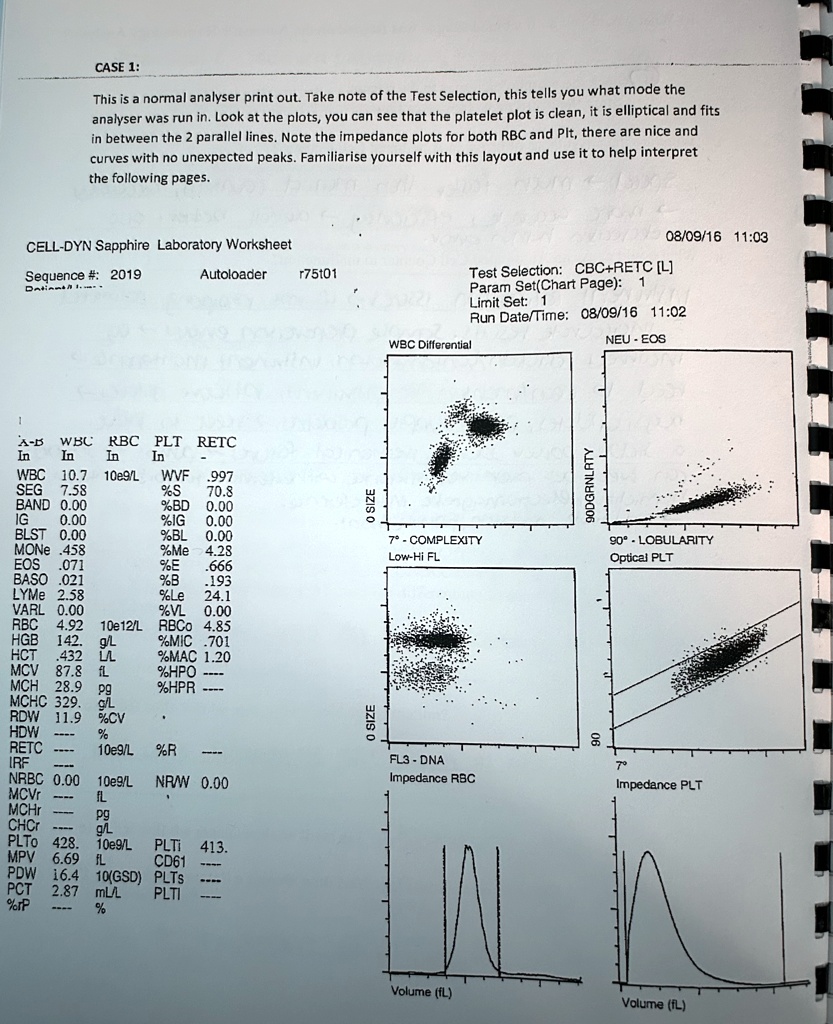
CASE1 This is a normal analyser print out. Take note of the Test Selection, this tells you what mode the analyser was run in. Look at the plots, you can see that the platelet plot is clean, it is elliptical and fits in between the 2 parallel lines. Note the impedance plots for both RBC and Plt, there are nice and curves with no unexpected peaks. Familiarise yourself with this layout and use it to help interpret the following pages
08/09/1611:03
CELL-DYN Sapphire Laboratory Worksheet
Sequence #:2019
Autoloader
r75t01
Test Selection:CBC+RETC[L] Param Set(Chart Page): 1 Limit Set1 Run Date/Time:08/09/16 11:02 WBC Differential NEU-EOS
X-B WBC RBC PLT RETC In In In In WBC 10.7 10e9/L WVF .997 SEG %S 70.8 BAND 0.00 %BD 0.00 IG 0.00 %IG 0.00 BLST 0.00 %BL 0.00 MONe .458 %Me 4.28 EOS .071 %E .666 BASO .021 %B .193 LYMe 2.58 %Le 24.1 VARL 0.00 %VL 0.00 RBC 4.92 10e12/L RBCo4.85 HGB 142 g/L %MIC.701 HCT 432 %MAC 1.20 MCV 87.8 fL %HPO MCH 28.9 pg %HPR MCHC 329 g/L RDW 11.9 %CV . HDW % RETC 10e9/L %R IRF NRBC 0.00 10e9/L NRW 0.00 MCVr fL MCHr CHCr PLTo 428 10e9/L PLTi 413 MPV 6.69 fL CD61 PDW 16.4 10GSD PLTs PCT 2.87 mLL PLTI %rP %
90DGRNLRTY 90-LOBULARITY Optical PLT
O SIZE 7-COMPLEXITY Low-Hi FL
OSIZE FL3-DNA Impedance RSC
Impedance PLT
Volume (fL)
Volume (fL)