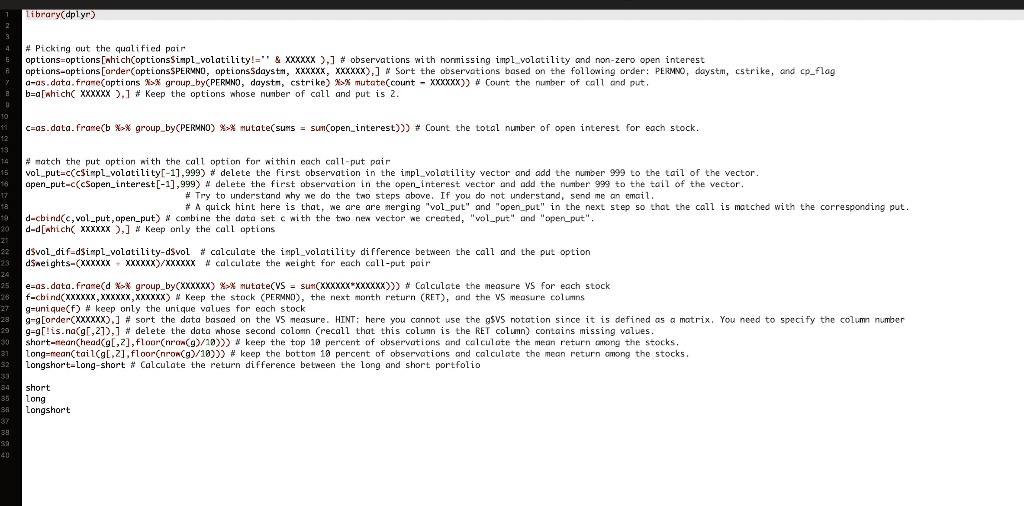
# Picking out the qualified pair
options = options[which(options$impl_volatility != '' & XXXXXX),] # observations with nonmissing impl_volatility and non-zero open interest
options = options[order(options$PERMNO, options$daystm, XXXXXX, XXXXXX),] # Sort the observations based on the following order: PERMNO, daystm, cstrike, and cp_flag
a = as.data.frame(options %>% group_by(PERMNO, daystm, cstrike) %>% mutate(count = XXXXXX)) # Count the number of call and put.
b = a[which( XXXXXX ),] # Keep the options whose number of call and put is 2.
c = as.data.frame(b %>% group_by(PERMNO) %>% mutate(sums = sum(open_interest))) # Count the total number of open interest for each stock.
# match the put option with the call option for within each call-put pair
vol_put = c(c$impl_volatility[-1], 999) # delete the first observation in the impl_volatility vector and add the number 999 to the tail of the vector.
open_put = c(c$open_interest[-1], 999) # delete the first observation in the open_interest vector and add the number 999 to the tail of the vector.
# Try to understand why we do the two steps above. If you do not understand, send me an email.
# A quick hint here is that, we are merging "vol_put" and "open_put" in the next step so that the call is matched with the corresponding put.
d = cbind(c, vol_put, open_put) # combine the data set c with the two new vector we created, "vol_put" and "open_put".
d = d[which( XXXXXX ),] # Keep only the call options
d$vol_dif = d$impl_volatility - d$vol # calculate the impl_volatility difference between the call and the put option
d$weights = (XXXXXX + XXXXXX) / XXXXXX # calculate the weight for each call-put pair
e = as.data.frame(d %>% group_by(XXXXXX) %>% mutate(VS = sum(XXXXXX * XXXXXX))) # Calculate the measure VS for each stock
f = cbind(XXXXXX, XXXXXX, XXXXXX) # Keep the stock (PERMNO), the next month return (RET), and the VS measure columns
g = unique(f) # keep only the unique values for each stock
g = g[order(XXXXXX),] # sort the data based on the VS measure. HINT: here you cannot use the g$VS notation since it is defined as a matrix. You need to specify the column number
g = g[!is.na(g[,2]),] # delete the data whose second column (recall that this column is the RET column) contains missing values.
short = mean(head(g[,2], floor(nrow(g)/10))) # keep the top 10 percent of observations and calculate the mean return among the stocks.
long = mean(tail(g[,2], floor(nrow(g)/10))) # keep the bottom 10 percent of observations and calculate the mean return among the stocks.
longshort = long - short # Calculate the return difference between the long and short portfolio
short
long
longshort
Library(dplyr)
# Picking out the qualified pair options = options[which(options$impl_volatility != " & XXXXXX ),] # observations with nonmissing impl_volatility and non-zero open interest options = options[order(options$PERMN0, options$daystm, XXXXXX, XXXXXX),] # Sort the observations based on the following order: PERMNO, daystm, cstrike, and cp_flag a = as.data.frame(options %>% group_by(PERMNO, daystm, cstrike) %>% mutate(count = XXXXXX)) # Count the number of call and put. b = a[which( XXXxxX ),] # Keep the options whose number of call and put is 2.
c = as.data.frarre(b X>X group_by(PERMNO) %>% mutate(sums = sum(open_interest))) # Count the total number of open interest for each stock.
# match the put option with the call option for within each call-put pair vol_put = c(c$impl_volatility[-1], 999) # delete the first observation in the impl_volatility vector and add the number 999 to the tail of the vector. open_put = c(cSopen_interest[-1], 999) # delete the first observation in the open_interest vector and add the number 999 to the tail of the vector. # Try to understand why we do the two steps above, If you do not understand, send me an email. # A quick hint here is that, we are merging "vol_put" and "open_put" in the next step so that the call is matched with the corresponding put. d = cbind(c, vol_put, open_put) # combine the data set c with the two new vector we created, "vol_put and "open_put". d = d[which( xxxxxx,] #Keep only the call options
d$vol_dif = d$impl_volatility - dSvol # calculate the impl_volatility difference between the call and the put option
e = as.data.frame(d X>X group_by(XXXXXX) %>% mutate(VS = Sum(XXXXXX * XXXXXX))) # Calculate the measure VS for each stock f = cbind(xxXXXX, xXXXXX, xXXXXX) # Keep the stock (PERMNO), the next month return (RET), and the VS measure columns g = unique(f) # keep only the unique values for each stock g = g[order(XXXXxX),] # sort the data based on the VS measure. HINT: here you cannot use the g$VS notation since it is defined as a matrix. You need to specify the column number g = g[!is.na(g[,2]),] # delete the data whose second column (recall that this column is the RET column) contains missing values. short = fean(head(g[,2], floor(nrow(g)/10))) # keep the top 10 percent of observations and calculate the mean return among the stocks. long = mean(tail(g[,2], floor(nrow(g)/10))) # keep the bottom 10 percent of observations and calculate the mean return cmong the stocks. Longshort = Long - short # Calculate the return difference between the long and short portfolio
short
long
longshort