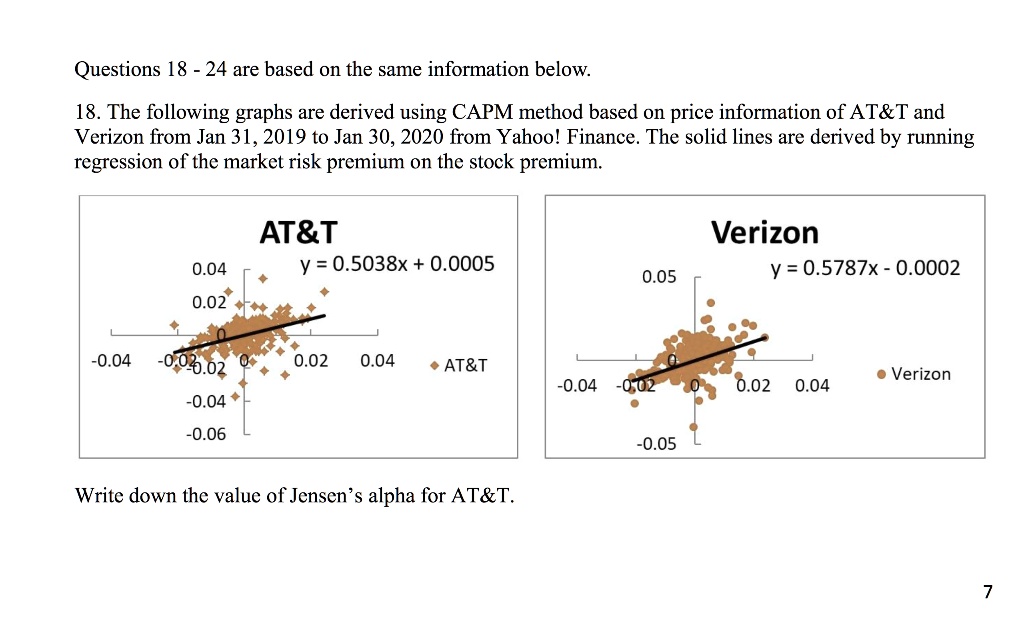
Questions 18 - 24 are based on the same information below.
18. The following graphs are derived using CAPM method based on price information of AT&T and
Verizon from Jan 31, 2019 to Jan 30, 2020 from Yahoo! Finance. The solid lines are derived by running
regression of the market risk premium on the stock premium.
AT&T
Verizon
0.04
y = 0.5038x + 0.0005
0.05
y = 0.5787x - 0.0002
0.02
-0.04 -0.02 0 0.02 0.04
• AT&T
-0.04
-0.06
Write down the value of Jensen's alpha for AT&T.
-0.04 -0.02 0 0.02 0.04
-0.05
• Verizon
7