Do the following calculations for the vehicle given below. Prepare the requested graphs.
- Passenger car with a 5.0 liters gasoline V12 front mounted engine, that is parallel to vehicle longitudinal axis
- Rear wheel drive with tires 225/60 ZR15
- $n_{engine,min}$ = 750 rpm, $n_{engine,max}$ = 5000 rpm
- Transmission ratios: $i_1$ = 2.48, $i_2$: 1.48, $i_3$ = 1.00, $i_4$ = 0.73, $i_{reverse}$ = 2.09, $i_{axle}$ = 3.15
A- First, suppose that the vehicle given above has a manual gearbox with the transmission ratios and the tires above. Plot the engine speed vs. vehicle speed graph. Determine the type of gearbox progression. Calculate the crawling speed of the vehicle.
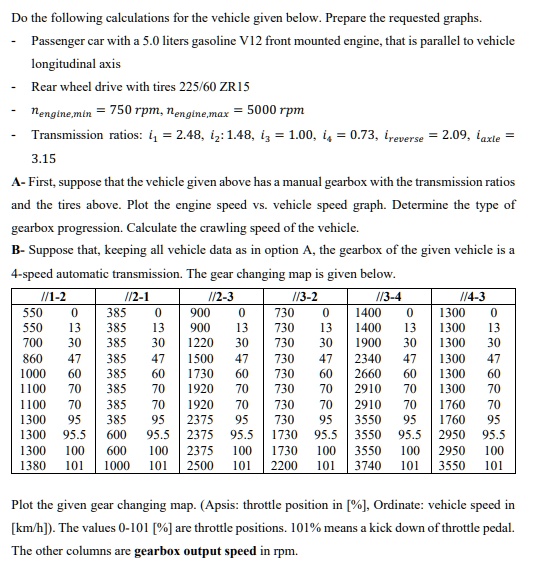
B- Suppose that, keeping all vehicle data as in option A, the gearbox of the given vehicle is a 4-speed automatic transmission. The gear changing map is given below.
//1-2
//2-1
//2-3
//3-2
//3-4
//4-3
550 0 385 0 900 0 730 0 1400 0 1300 0
550 13 385 13 900 13 730 13 1400 13 1300 13
700 30 385 30 1220 30 730 30 1900 30 1300 30
860 47 385 47 1500 47 730 47 2340 47 1300 47
1000 60 385 60 1730 60 730 60 2660 60 1300 60
1100 70 385 70 1920 70 730 70 2910 70 1300 70
1100 70 385 70 1920 70 730 70 2910 70 1760 70
1300 95 385 95 2375 95 730 95 3550 95 1760 95
1300 95.5 600 95.5 2375 95.5 1730 95.5 3550 95.5 2950 95.5
1300 100 600 100 2375 100 1730 100 3550 100 2950 100
1380 101 1000 101 2500 101 2200 101 3740 101 3550 101
Plot the given gear changing map. (Apsis: throttle position in [%], Ordinate: vehicle speed in [km/h]). The values 0-101 [%] are throttle positions. 101% means a kick down of throttle pedal. The other columns are gearbox output speed in rpm.