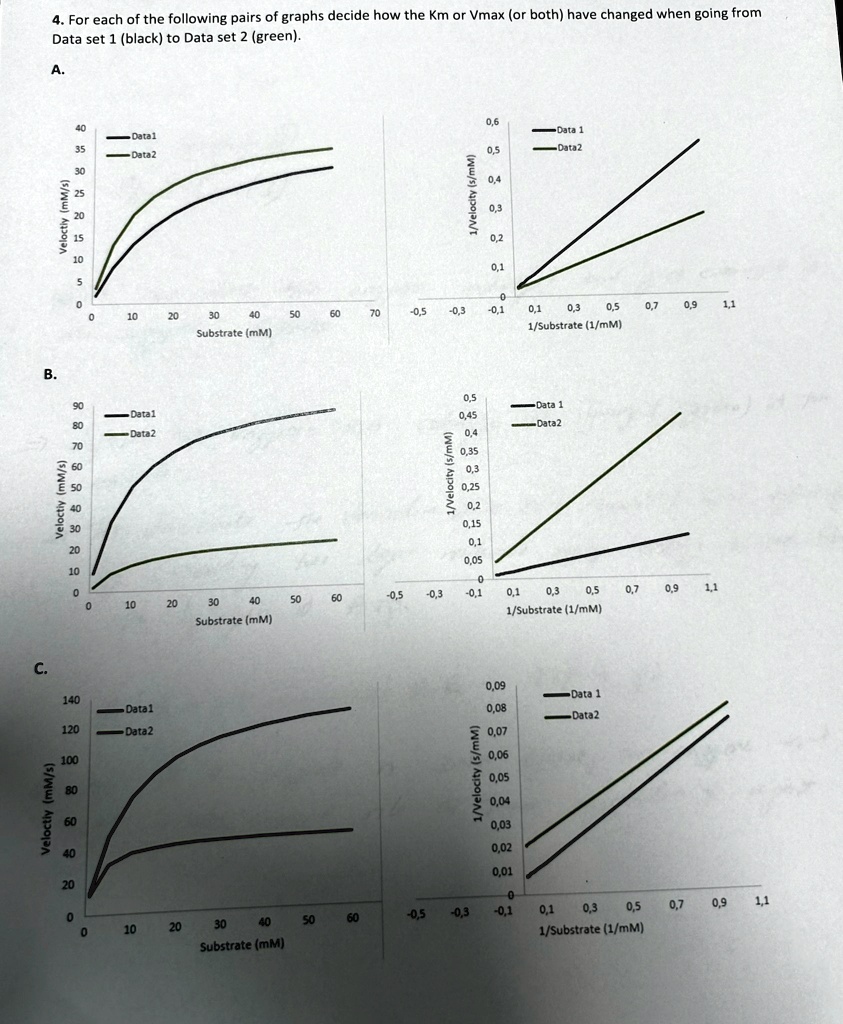
4. For each of the following pairs of graphs decide how the Km or Vmax (or both) have changed when going from
Data set 1 (black) to Data set 2 (green).
A.
40
35
30
25
20
15
10
5
0
Veloctiy (mM/s)
Datal
Data2
0,6
0,5
0,4
0,3
0,2
0,1
0
1/Velocity (s/mM)
Data 1
-Data2
0
10
20
30
40
50
60
70
-0,5 -0,3
-0,1
0,1
0,3
0,5
0,7
0,9
1,1
Substrate (mM)
1/Substrate (1/mM)
B.
90
80
70
60
50
40
30
20
10
0
Veloctiy (mM/s)
Datal
Data2
0,45
Data 1
Data2
1/Velocity (s/mM)
0.4
0,35
0.3
0.25
0,2
0,15
0,1
0,05
0
0
10
20
30
40
50
60
-0,5
-0,3
-0,1
0.1
Substrate (mM)
0,5 0,7 0,9 1,1
0,3
1/Substrate (1/mM)
C.
140
Datal
120
Data2
100
0,09
-Data 1
0,08
Data2
Veloctiy (mM/s)
1/Velocity (s/mM)
0,07
0,06
0,05
0,04
0,03
0,02
0,01
0
0
0
10
20
30
40
50
60
-0,5
-0,3
-0,1
0,1
0,3
0,5
0,7
Substrate (mM)
1/Substrate (1/mM)
0,9
1,1