Sample Statistic
5B.53 Smiles and Leniency
Data 4.2 describes an experiment to study the effects of smiling on leniency in judging students accused of
cheating. The full data are in Smiles. In Example 4.21 we consider hypotheses $H_0: \mu_s = \mu_n$ vs $H_a: \mu_s > \mu_n$ to
test whether the data provide evidence that average leniency score is higher for smiling students ($\mu_s$) than for
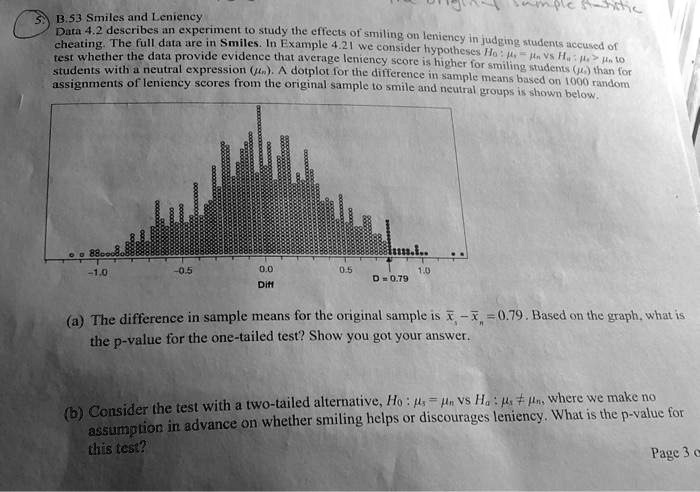
students with a neutral expression ($\mu_n$). A dotplot for the difference in sample means based on 1000 random
assignments of leniency scores from the original sample to smile and neutral groups is shown below.
•• 8800080
-1.0
-0.5
0.0
Diff
0.5
1.0
D = 0.79
(a) The difference in sample means for the original sample is $\bar{x}_s - \bar{x}_n = 0.79$. Based on the graph, what is
the p-value for the one-tailed test? Show you got your answer.
(b) Consider the test with a two-tailed alternative, $H_0: \mu_s = \mu_n$ vs $H_a: \mu_s \neq \mu_n$, where we make no
assumption in advance on whether smiling helps or discourages leniency. What is the p-value for
this test?
Page 3 c