Need help for this question, need to check where I went wrong, much help appreciated In the recent publication (available online 28 January 2023) “Performance evolution inmachining parameter of Al-Si (LM6) alloy using neural network” in the Materials Today:Proceedings journal, the authors explore the influence of cutting speed, feed, depth of cut,and coolant flow rate, each at three levels, on surface finish.Their aim was to identify the optimal combination of parameters that would lead to theminimal surface roughness measured in μm.Process parameters and their levels are given in Table Q1a.Taguchi L9 orthogonal array was used. Experimental design and measured change in surfaceroughness are given in Table Q1b.a) Determine the optimal combination of parameter levels.[13 marks](b) Identify the dominant parameter.[2 marks]M23993 – Design for Quality2022-2023 Page | 2(c) Authors concluded that the optimal process parameter settings are : 0.8 mm Depthof cut, 2600 rpm Spindle speed, 0.05 mm Feed rate and 0.02 lit/sec Coolant flow rate.Did you identify this parameter combination as optimal? What should be done in thiscase?[2 marks](d) Can you confirm the optimal process parameters setting through observations?
1. In the recent publication (available online 28 January 2023) "Performance evolution in
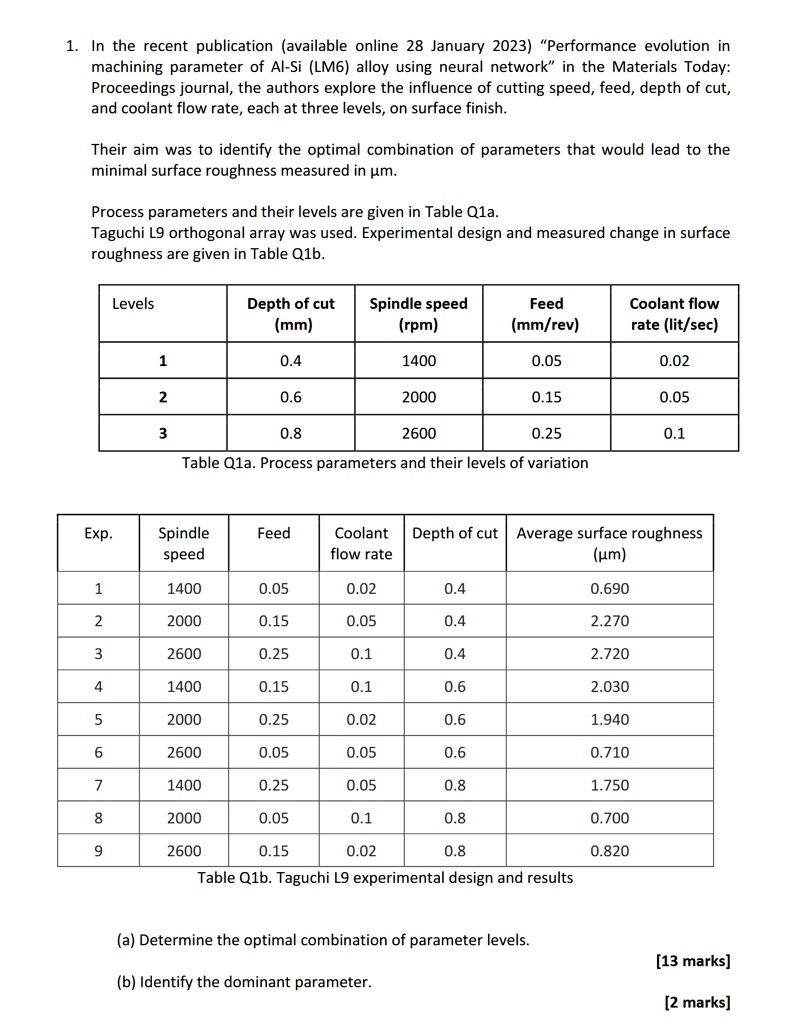
machining parameter of Al-Si (LM6) alloy using neural network" in the Materials Today: Proceedings journal, the authors explore the influence of cutting speed, feed, depth of cut, and coolant flow rate,each at three levels,on surface finish.
Their aim was to identify the optimal combination of parameters that would lead to the minimal surface roughness measured in um.
Process parameters and their levels are given in Table Q1a Taguchi L9 orthogonal array was used.Experimental design and measured change in surface roughness are given in Table Q1b
Levels
Depth of cut (mm)
Spindle speed (rpm)
Feed (mm/rev)
Coolant flow rate (lit/sec)
1
0.4
1400
0.05
0.02
2
0.6
2000
0.15
0.05
3
0.8
2600
0.25
0.1
Table Q1a.Process parameters and their levels of variation
Exp.
Spindle speed
Feed
Coolant Depth of cut Average surface roughness flow rate (m)
1
1400
0.05
0.02
0.4
0.690
2
2000
0.15
0.05
0.4
2.270
3
2600
0.25
0.1
0.4
2.720
4
1400
0.15
0.1
0.6
2.030
5
2000
0.25
0.02
0.6
1.940
6
2600
0.05
0.05
0.6
0.710
7
1400
0.25
0.05
0.8
1.750
8
2000
0.05
0.1
0.8
0.700
9
2600
0.15
0.02
0.8
0.820
Table Q1b.Taguchi L9 experimental design and results
a Determine the optimal combination of parameter levels
[13 marks]
(b)Identify the dominant parameter
[2 marks]