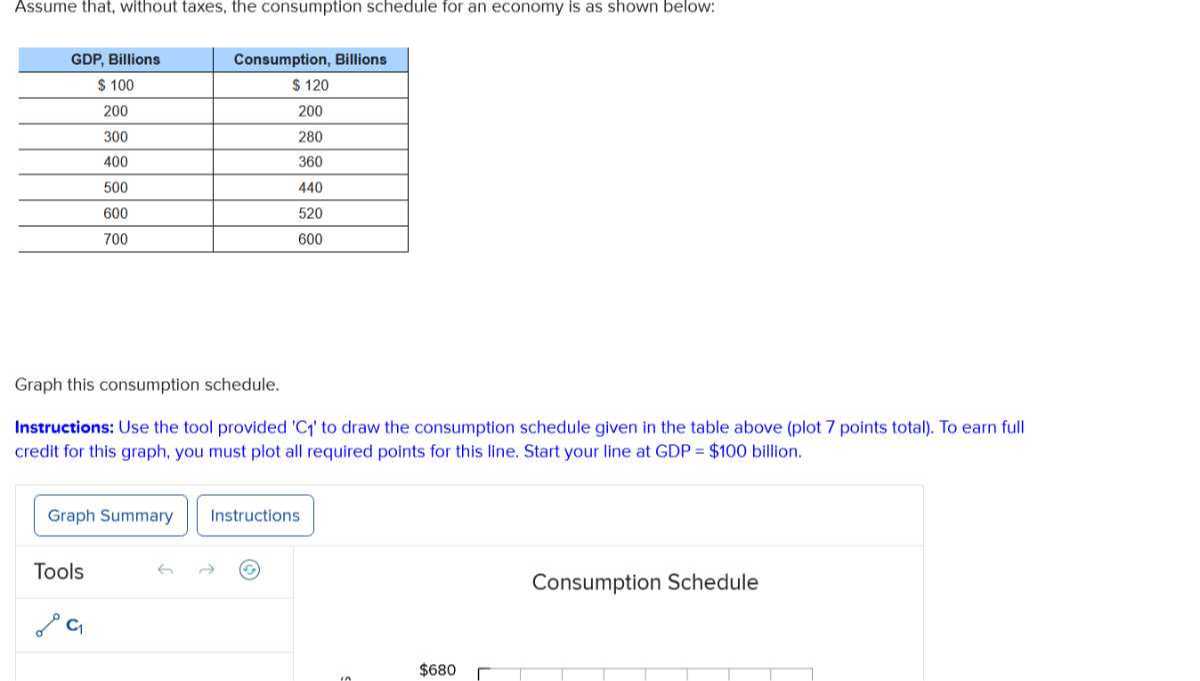
Assume that, without taxes, the consumption schedule for an economy is as shown below:
\begin{tabular}{c|c|}
\hline GDP, Billions & Consumption, Billions \\
\hline\( \$ 100 \) & \( \$ 120 \) \\
\hline 200 & 200 \\
\hline 300 & 280 \\
\hline 400 & 360 \\
\hline 500 & 440 \\
\hline 600 & 520 \\
\hline 700 & 600 \\
\hline
\end{tabular}
Graph this consumption schedule.
Instructions: Use the tool provided ' C ' to draw the consumption schedule given in the table above (plot 7 points total). To earn full credit for this graph, you must plot all required points for this line. Start your line at GDP \( =\$ 100 \) billion.
Graph Summary
Instructions
Tools
Consumption Schedule
\( \mathbf{C}_{1} \)