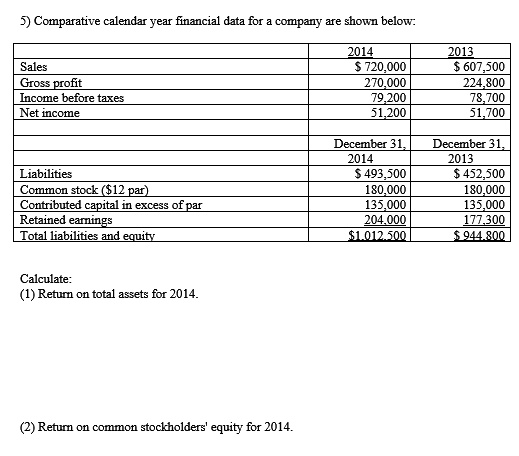
5) Comparative calendar year financial data for a company are shown below:
Sales
Gross profit
Income before taxes
Net income
2014
$ 720,000
270,000
79,200
51,200
2013
$ 607,500
224,800
78,700
51,700
Liabilities
Common stock ($12 par)
Contributed capital in excess of par
Retained earnings
Total liabilities and equity
December 31,
December 31,
2014
2013
$ 493,500
$ 452,500
180,000
180,000
135,000
135,000
204,000
177,300
$1.012.500
$ 944.800
Calculate:
(1) Return on total assets for 2014.
(2) Return on common stockholders' equity for 2014.