Title: Free Throw Data and Hypothesis Testing
Text:
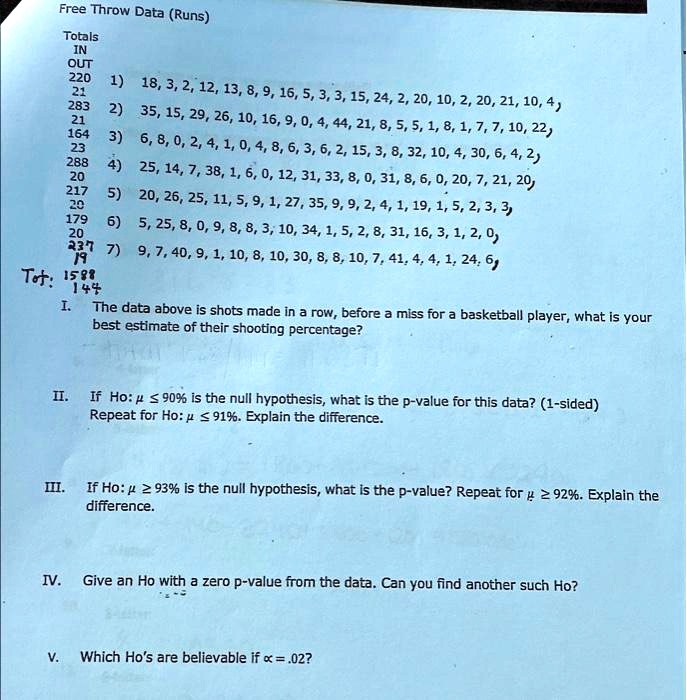
Free Throw Data (Runs Totals NI OUT 220 1) 21 18, 3, 2, 12, 13, 8, 9, 16, 5, 3, 3, 15, 24, 2, 20, 10, 2, 20, 21, 10, 4 283 2) 21 164 3) 23 6, 8, 0, 2, 4, 1, 0, 4, 8, 6, 3, 6, 2, 15, 3, 8, 32, 10, 4, 30, 6, 4, 2 288 4) 20 25, 14, 7, 38, 1, 6, 0, 12, 31, 33, 8, 0, 31, 8, 6, 0, 20, 7, 21, 20 217 20 520, 26, 25, 11, 5, 9, 1, 27, 35, 9, 9, 2, 4, 1, 19, 1, 5, 2, 3, 3 179 6) 5, 25, 8, 0, 9, 8, 8, 3, 10, 34, 1, 5, 2, 8, 31, 16, 3, 1, 2, 0 19 79, 7, 40, 9, 1, 10, 8, 10, 30, 8, 8, 10, 7, 41, 4, 4, 1, 24, 6 Tof: 1588 144
I. The data above is shots made in a row before a miss for a basketball player. What is your best estimate of their shooting percentage?
II. If Ho: 90% is the null hypothesis, what is the p-value for this data? 1-sided. Repeat for Ho: 91%. Explain the difference.
III. If Ho: 93% is the null hypothesis, what is the p-value? Repeat for 92%. Explain the difference.
IV. Give an Ho with a zero p-value from the data. Can you find another such Ho?
V. Which Ho's are believable if α = 0.02?