DATAfile: MonitorRatings
A statistical program is recommended.
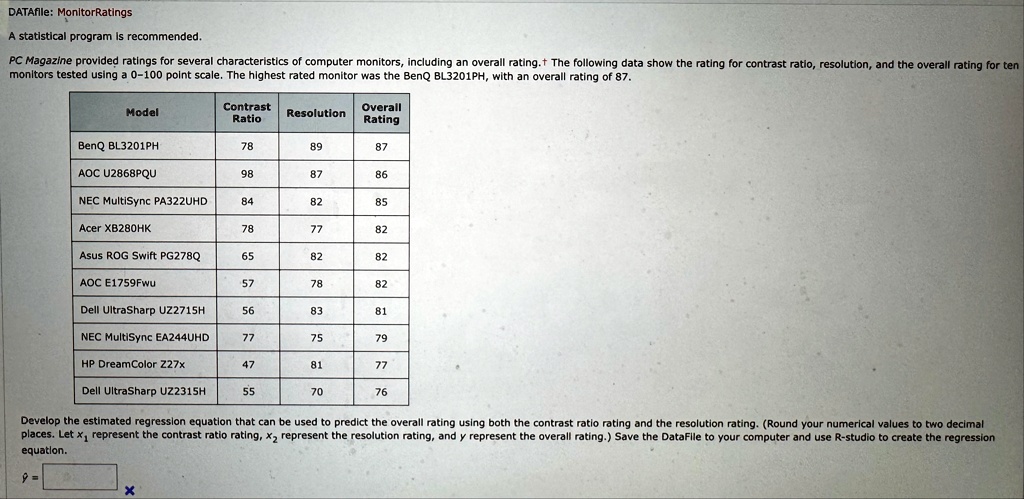
PC Magazine provided ratings for several characteristics of computer monitors, including an overall rating.† The following data show the rating for contrast ratio, resolution, and the overall rating for ten
monitors tested using a 0-100 point scale. The highest rated monitor was the BenQ BL3201PH, with an overall rating of 87.
Model
Contrast
Ratio
Resolution
Overall
Rating
BenQ BL3201PH
78
89
87
AOC U2868PQU
98
87
86
NEC MultiSync PA322UHD
84
82
85
Acer XB280HK
78
77
82
Asus ROG Swift PG278Q
65
82
82
AOC E1759Fwu
57
78
82
Dell UltraSharp UZ2715H
56
83
81
NEC MultiSync EA244UHD
77
75
79
HP DreamColor Z27x
47
81
77
Dell UltraSharp UZ2315H
55
70
76
Develop the estimated regression equation that can be used to predict the overall rating using both the contrast ratio rating and the resolution rating. (Round your numerical values to two decimal
places. Let x₁ represent the contrast ratio rating, x₂ represent the resolution rating, and y represent the overall rating.) Save the DataFile to your computer and use R-studio to create the regression
equation.
ŷ =
X