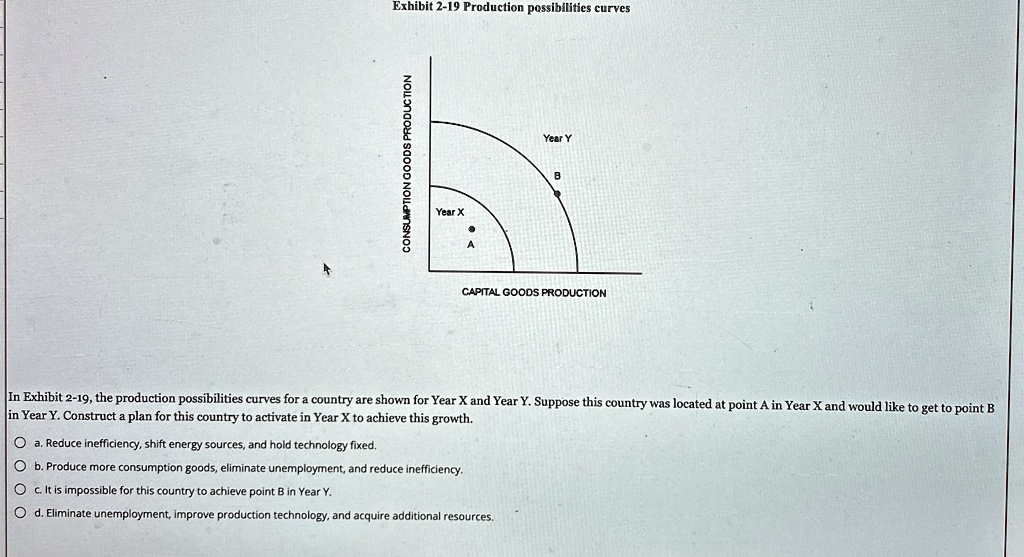
Exhibit 2-19 Production possibilities curves
CONSUMPTION GOODS PRODUCTION
Year X
Year Y
CAPITAL GOODS PRODUCTION
In Exhibit 2-19, the production possibilities curves for a country are shown for Year X and Year Y. Suppose this country was located at point A in Year X and would like to get to point B
in Year Y. Construct a plan for this country to activate in Year X to achieve this growth.
Oa. Reduce inefficiency, shift energy sources, and hold technology fixed.
Ob. Produce more consumption goods, eliminate unemployment, and reduce inefficiency.
Oc. It is impossible for this country to achieve point B in Year Y.
Od. Eliminate unemployment, improve production technology, and acquire additional resources.