HW 43-Applications of Solving Equations: Problem 7
(1 point)
Suppose that the average temperature in Lincoln, NE in degrees Fahrenheit $t$ months after January 1, 2016 (that is, January 1 corresponds to $t = 0$) is given by
the following equation:
$T(t) = -30 \cos\left(\frac{\pi}{6}t\right) + 60$.
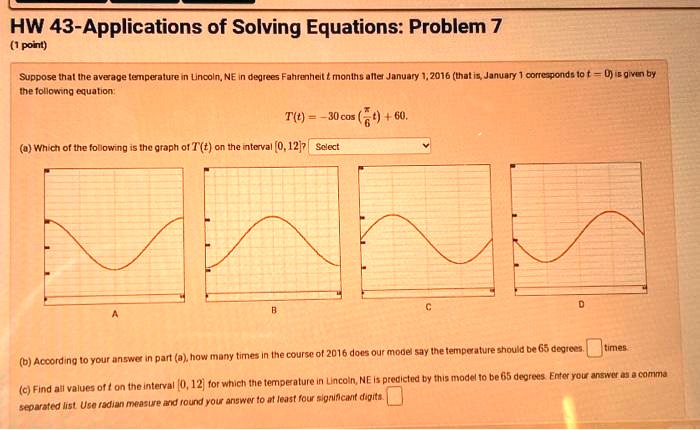
(a) Which of the following is the graph of $T(t)$ on the interval $[0, 12]$?
Select
A
B
C
D
(b) According to your answer in part (a), how many times in the course of 2016 does our model say the temperature should be 65 degrees. times
(c) Find all values of $t$ on the interval $[0, 12]$ for which the temperature in Lincoln, NE is predicted by this model to be 65 degrees. Enter your answer as a comma
separated list. Use radian measure and round your answer to at least four significant digits.