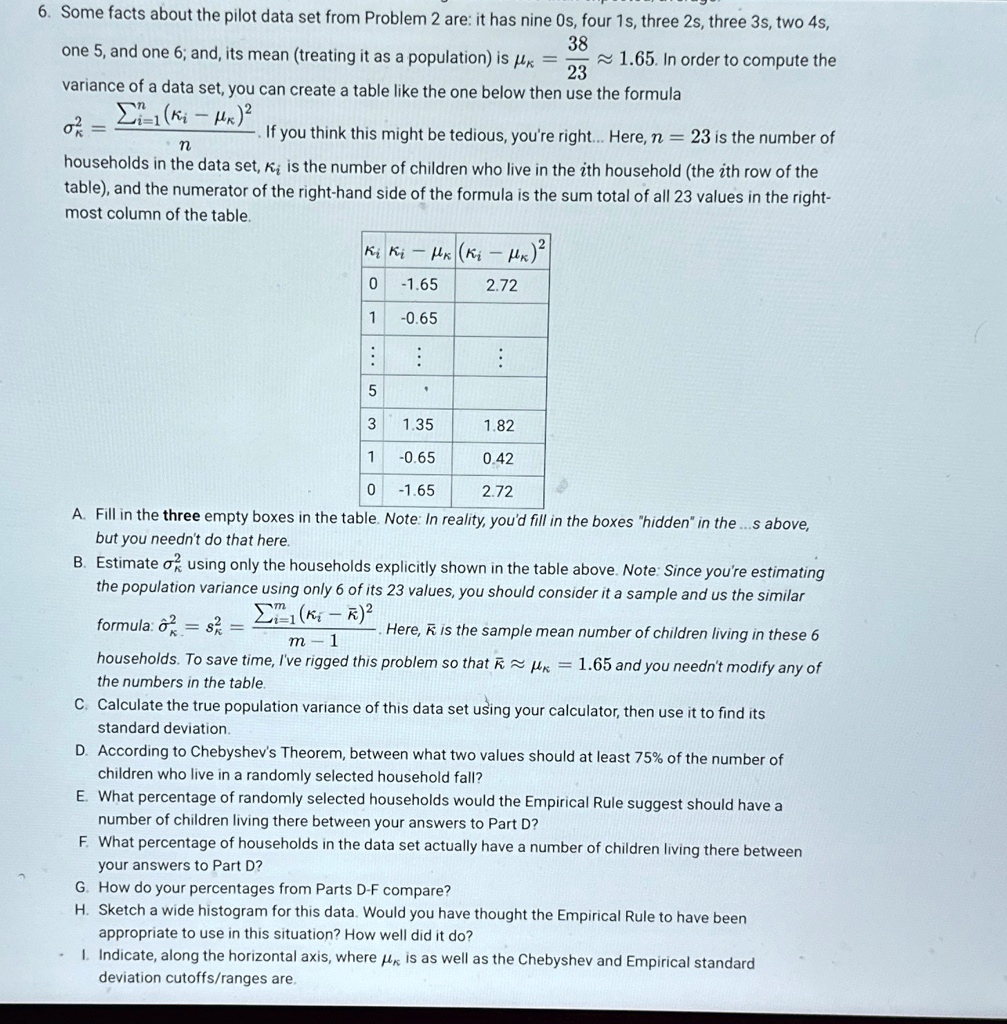
6.Some facts about the pilot data set from Problem 2 are: it has nine 0s, four 1s, three 2s, three 3s, two 4s, one 5 , and one 6 ; and, its mean (treating it as a population) is mu _(kappa )=(38)/(23)~~1.65. In order to compute the variance of a data set, you can create a table like the one below then use the formula
sigma _(kappa )^(2)=(sum_(i=1)^n (kappa _(i)-mu _(kappa ))^(2))/(n). If you think this might be tedious, you're right... Here, n=23 is the number of households in the data set, kappa _(i) is the number of children who live in the i th household (the i th row of the table), and the numerator of the right-hand side of the formula is the sum total of all 23 values in the rightmost column of the table.
able[[kappa _(i),kappa _(i)-mu _(kappa ),(kappa _(i)-mu _(kappa ))^(2)
6.Some facts about the pilot data set from Problem 2 are:it has nine Os,four 1s,three 2s,three 3s,two 4s, 38 1.65.In order to compute the variance of a data set, you can create a table like the one below then use the formula =D=1K- n If you think this might be tedious,you're right... Here,n =23 is the number of households in the data set, K; is the number of children who live in the ith household (the ith row of the table), and the numerator of the right-hand side of the formula is the sum total of all 23 values in the right- most column of the table
0
-1.65
2.72
-0.65
...
...
5
3
1.35
1.82
-0.65
0.42
-1.65
2.72
but you needn't do that here.
B. Estimate o? using only the households explicitly shown in the table above. Note: Since you're estimating the population variance using only 6 of its 23 values,you should consider it a sample and us the similar Here, is the sample mean number of children living in these 6 m-1 households.To save time, I've rigged this problem so that K~=1.65 and you needn't modify any of the numbers in the table C. Calculate the true population variance of this data set using your calculator, then use it to find its standard deviation. D. According to Chebyshev's Theorem,between what two values should at least 75% of the number of children who live in a randomly selected household fall? E. What percentage of randomly selected households would the Empirical Rule suggest should have a number of children living there between your answers to Part D? F. What percentage of households in the data set actually have a number of children living there between your answers to Part D? G.How do your percentages from Parts D-F compare? H. Sketch a wide histogram for this data. Would you have thought the Empirical Rule to have been appropriate to use in this situation? How well did it do? I.Indicate,along the horizontal axis,where is as well as the Chebyshev and Empirical standard deviation cutoffs/ranges are