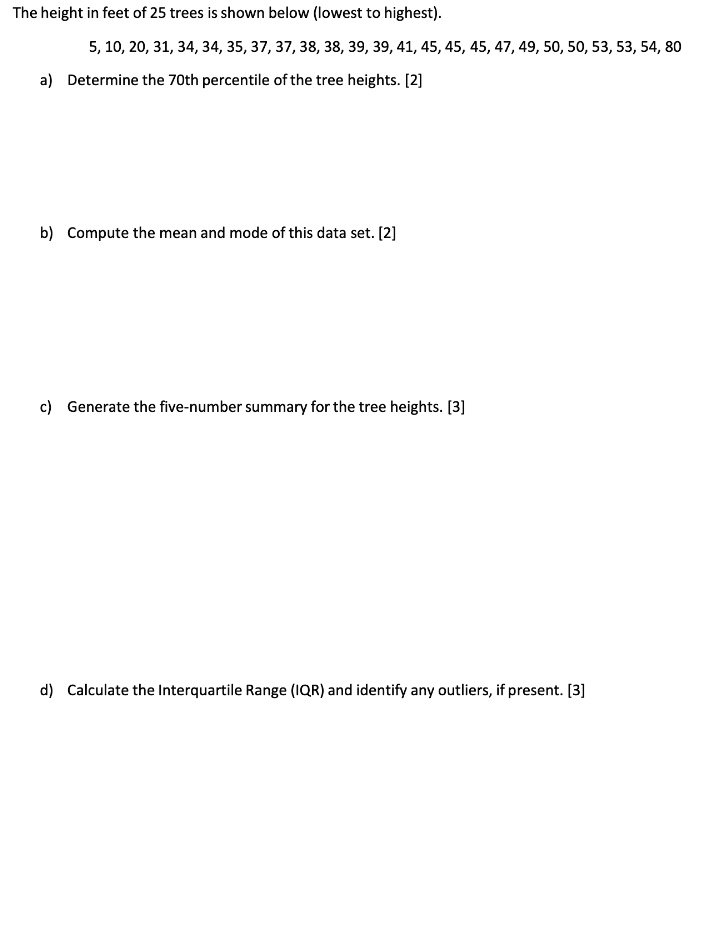
The height in feet of 25 trees is shown below (lowest to highest).
5, 10, 20, 31, 34, 34, 35, 37, 37, 38, 38, 39, 39, 41, 45, 45, 45, 47, 49, 50, 50, 53, 53, 54, 80
a) Determine the 70th percentile of the tree heights. [2]
b) Compute the mean and mode of this data set. [2]
c) Generate the five-number summary for the tree heights. [3]
d) Calculate the Interquartile Range (IQR) and identify any outliers, if present. [3]