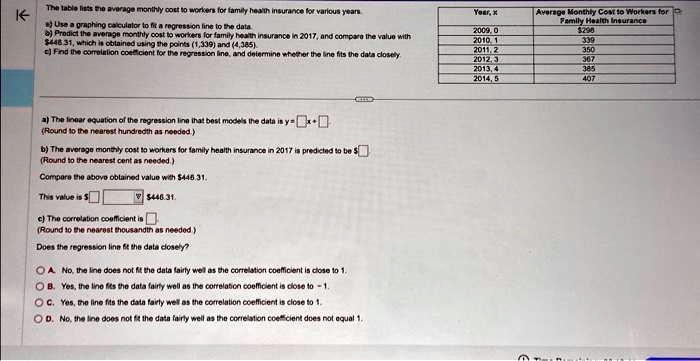
The table lists the average monthly cost to workers for family health insurance for various years
Year, x
Average Monthly Cost to Workers for
Family Health insurance
8) Use a graphing calculator to fit a regression line to the data.
b) Predict the average monthly cost to workers for family health insurance in 2017, and compare the value with
$448.31, which is obtained using the points (1,339) and (4,385).
c) Find the correlation coefficient for the regression line, and determine whether the line fits the data closely
2009,0
$298
2010, 1
339
2011,2
350
2012,3
367
2013, 4
385
2014, 5
407
a) The linear equation of the regression line that best models the data is $y = \boxed{}x + \boxed{}$
(Round to the nearest hundredth as needed.)
b) The average monthly cost to workers for family health insurance in 2017 is predicted to be $\boxed{}
(Round to the nearest cent as needed.)
Compare the above obtained value with $446.31.
This value is $\boxed{} \boxed{} $446.31.
c) The correlation coefficient is $\boxed{}
(Round to the nearest thousandth as needed)
Does the regression line fit the data closely?
A. No, the line does not fit the data fairly well as the correlation coefficient is close to 1.
B. Yes, the line fits the data fairly well as the correlation coefficient is close to -1.
C. Yes, the line fits the data fairly well as the correlation coefficient is close to 1.
D. No, the line does not fit the data fairly well as the correlation coefficient does not equal 1.