Optimum Conditions for Enzyme Activity:
As you have learned in lecture, enzymes are proteins that catalyze chemical reactions. Most enzymes have optimum conditions under which they work best, including an optimum temperature, an optimum pH and an optimum substrate concentration. The following table contains a typical set of results that you might get if you did three separate experiments to determine the optimum pH, temperature and substrate concentration for an enzyme. In this case, the enzyme is an amylase enzyme that converts starch to glucose. This amylase enzyme is produced by an acidophilic bacteria called Acetobacter aceti. A. aceti is the bacterium that converts sugars into acetic acid (often used in the food industry to make vinegar).
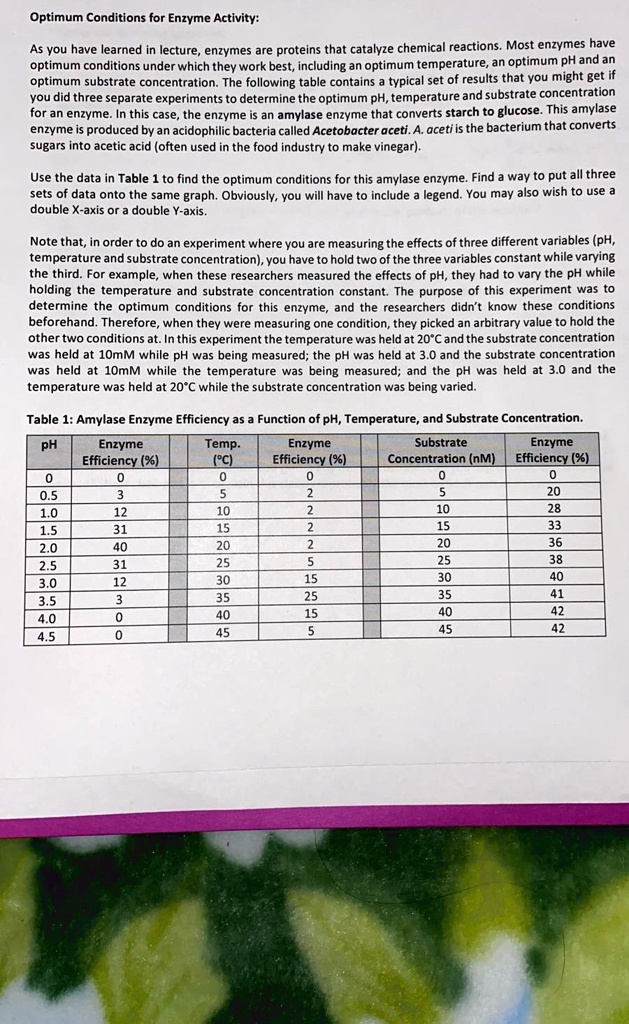
Use the data in Table 1 to find the optimum conditions for this amylase enzyme. Find a way to put all three sets of data onto the same graph. Obviously, you will have to include a legend. You may also wish to use a double X-axis or a double Y-axis.
Note that, in order to do an experiment where you are measuring the effects of three different variables (pH, temperature and substrate concentration), you have to hold two of the three variables constant while varying the third. For example, when these researchers measured the effects of pH, they had to vary the pH while holding the temperature and substrate concentration constant. The purpose of this experiment was to determine the optimum conditions for this enzyme, and the researchers didn't know these conditions beforehand. Therefore, when they were measuring one condition, they picked an arbitrary value to hold the other two conditions at. In this experiment the temperature was held at 20°C and the substrate concentration was held at 10mM while pH was being measured; the pH was held at 3.0 and the substrate concentration was held at 10mM while the temperature was being measured; and the pH was held at 3.0 and the temperature was held at 20°C while the substrate concentration was being varied.
Table 1: Amylase Enzyme Efficiency as a Function of pH, Temperature, and Substrate Concentration.
pH | Enzyme Efficiency (%) | Temp. (°C) | Enzyme Efficiency (%) | Substrate Concentration (nM) | Enzyme Efficiency (%)
--- | --- | --- | --- | --- | ---
0 | 0 | 0 | 0 | 0 | 0
0.5 | 3 | 5 | 2 | 5 | 20
1.0 | 12 | 10 | 2 | 10 | 28
1.5 | 31 | 15 | 2 | 15 | 33
2.0 | 40 | 20 | 2 | 20 | 36
2.5 | 31 | 25 | 5 | 25 | 38
3.0 | 12 | 30 | 15 | 30 | 40
3.5 | 3 | 35 | 25 | 35 | 41
4.0 | 0 | 40 | 15 | 40 | 42
4.5 | 0 | 45 | 5 | 45 | 42