hello, can someone do this in matlab
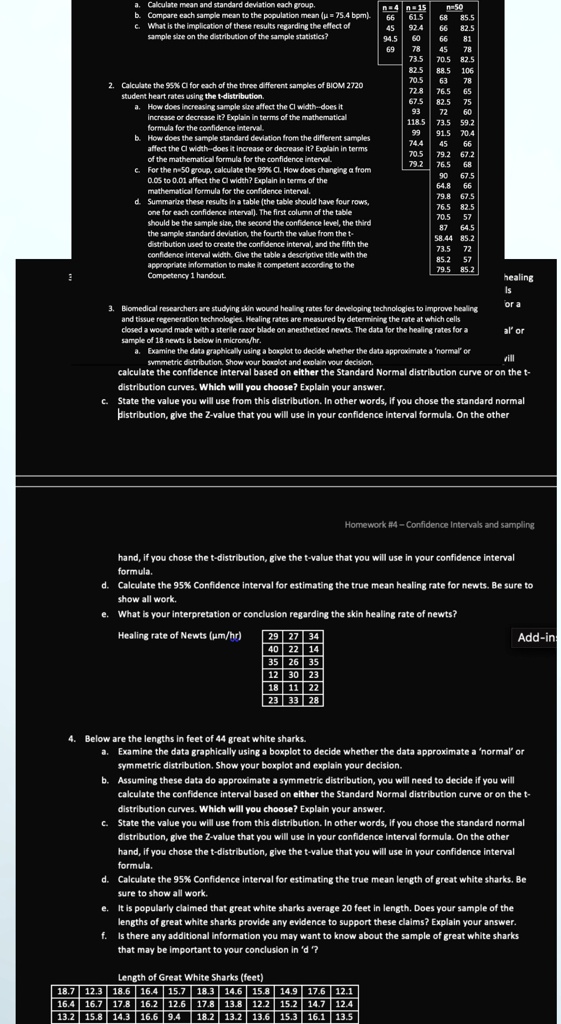
Compare each sample mean to the population mean ( = 75.4 bpm)
n4 n = 15 61.5 45 92.4 94.5
n=50 85.5 82.5
Sample size on the distribution of the sample statistics?
73.5 82.5 88.5 106 70.5 63 78 72.8 76.5 65 67,5 82.5 75 93 72 60 118.5 73.5 59.2 99 91.5 70.4 74,4 45 66 70.5 79.2 67.2 79,2 76.5 68 90 67.5 64.8 66 79,g 76.5 82.5 70.5 57 87 64.5 58.44 85.2 73.5 85.2 79.5
Calculate the 95% CI for each of the threedifferent samples of BIOM 2720
increase or decrease it? Explain in terms of the mathematical
b. How does the sample standard deviation from the different samples affect the CI widthdoes it increase or decrease it? Explain in terms of the mathematical formula for the confidence interval C. For the n50 group, calculate the 99%Cl. How does changing from 0.05 to 0.01 affect the CI width? Explain in terms of the mathematical formula for the confidence interval
healing
Biomedical researchers are studying skin wound healing rates for developing technologies to improve healing closed a wound made with a sterile razor blade on anesthetized newts. The data for the healing rates for a
ora
al'or
Examine the data graphically using a boxplot to decide whether the data approximate a normal or
vill
calculate the confidence interval based on either the Standard Normal distribution curve or on the t- distribution curves.Which will you choose? Explain your answer. - State the value you will use from this distribution. In other words, if you chose the standard normal pistribution,give the Z-value that you will use in your confidence interval formula. On the other
Homework #4 Confidence Intervals and sampling
hand, if you chose the t-distribution,give the t-value that you will use in your confidence interval formula. Calculate the 95% Confidence interval for estimating the true mean healing rate for newts. Be sure to show all work. e What is your interpretation or conclusion regarding the skin healing rate of newts?
Healing rate of Newts (m/hr)
292734 402214 352635 12 23 18 1122 233328
Add-in
Below are the lengths in feet of 44 great white sharks. Examine the data graphically using a boxplot to decide whether the data approximate a normal or symmetric distribution. Show your boxplot and explain your decision. Assuming these data do approximate a symmetric distribution, you will need to decide if you will calculate the confidence interval based on either the Standard Normal distribution curve or on the t- distribution curves. Which will you choose? Explain your answer. State the value you will use from this distribution. In other words, if you chose the standard normal distribution, give the Z-value that you will use in your confidence interval formula. On the other hand, if you chose the t-distribution, give the t-value that you will use in your confidence interval formula, Calculate the 95% Confidence interval for estimating the true mean length of great white sharks. Be sure to show all work. It is popularly claimed that great white sharks average 20 feet in length. Does your sample of the lengths of great white sharks provide any evidence to support these claims? Explain your answer. Is there any additional information you may want to know about the sample of great white sharks that may be important to your conclusion in 'd ?
Length of Great White Sharks (feet) 16.4 15.7 18.3 14.6 15.8 14.917.6 12.1 16.416.717.816.212.617.813.812.215.214.712.4 13.215.8 13.5