Texts: Question 4
10 marks
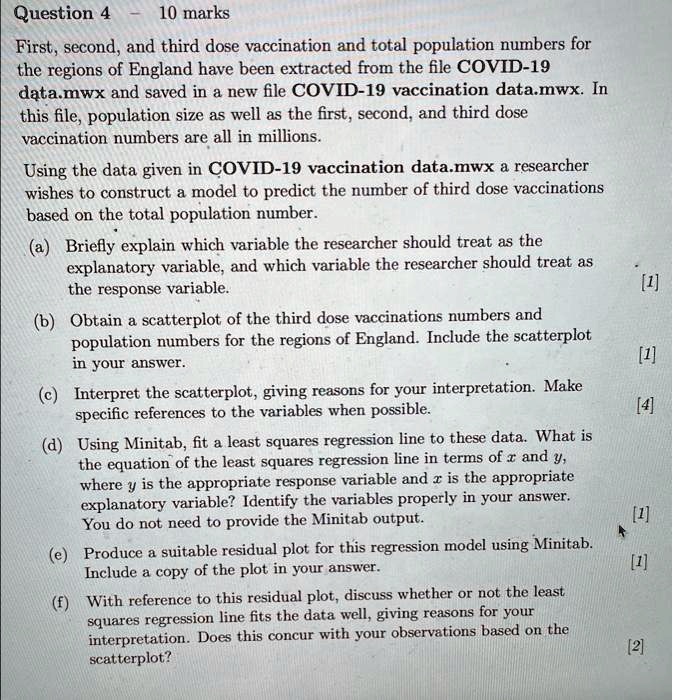
First, second, and third dose vaccination and total population numbers for the regions of England have been extracted from the file COVID-19 data.mwx and saved in a new file COVID-19 vaccination data.mwx. In this file, population size as well as the first, second, and third dose vaccination numbers are all in millions. Using the data given in COVID-19 vaccination data.mwx, a researcher wishes to construct a model to predict the number of third dose vaccinations based on the total population number.
a) Briefly explain which variable the researcher should treat as the explanatory variable, and which variable the researcher should treat as the response variable. [1]
b) Obtain a scatterplot of the third dose vaccination numbers and population numbers for the regions of England. Include the scatterplot in your answer. [1]
c) Interpret the scatterplot, giving reasons for your interpretation. Make specific references to the variables when possible. [4]
d) Using Minitab, fit a least squares regression line to these data. What is the equation of the least squares regression line in terms of x and y, where y is the appropriate response variable and x is the appropriate explanatory variable? Identify the variables properly in your answer. You do not need to provide the Minitab output. [1]
e) Produce a suitable residual plot for this regression model using Minitab. Include a copy of the plot in your answer. [1]
f) With reference to this residual plot, discuss whether or not the least squares regression line fits the data well, giving reasons for your interpretation. Does this concur with your observations based on the scatterplot? [2]