Score: 0 of 1 pt
Concept Question 2.19
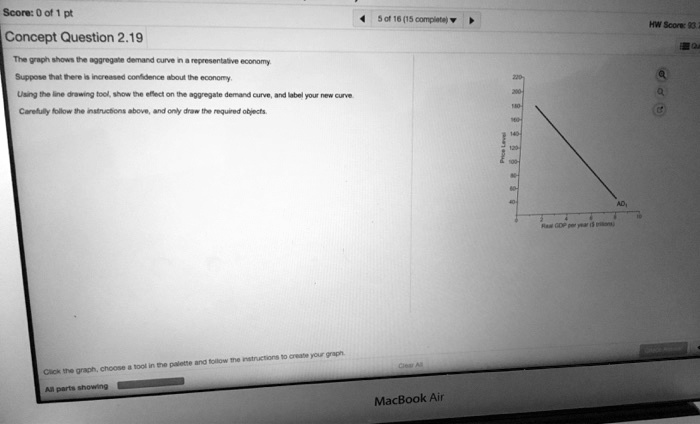
The graph shows the aggregate demand curve in a representative economy.
Suppose that there is increased confidence about the economy.
Using the line drawing tool, show the effect on the aggregate demand curve, and label your new curve.
Carefully follow the instructions above, and only draw the required objects.
5 of 16 (15 complete)
Click the graph, choose a tool in the palette and follow the instructions to create your graph
All parts showing
Clear All
MacBook Air
Price Level
HW Score: 933
220
200
180
160
140
120
100
80
60
40
20
0
AD$_0$
Real GDP per year ($ trillions)
2
4
6
8
10