Now create a function buildPanelData that takes a date range a list of countries and a list of indicators, returning a single dataFrame with
columns for each indicator. Use the buildCountryData as a building block (i.e., just concat the dataframes you created above.
[] Start coding or generate with AI.
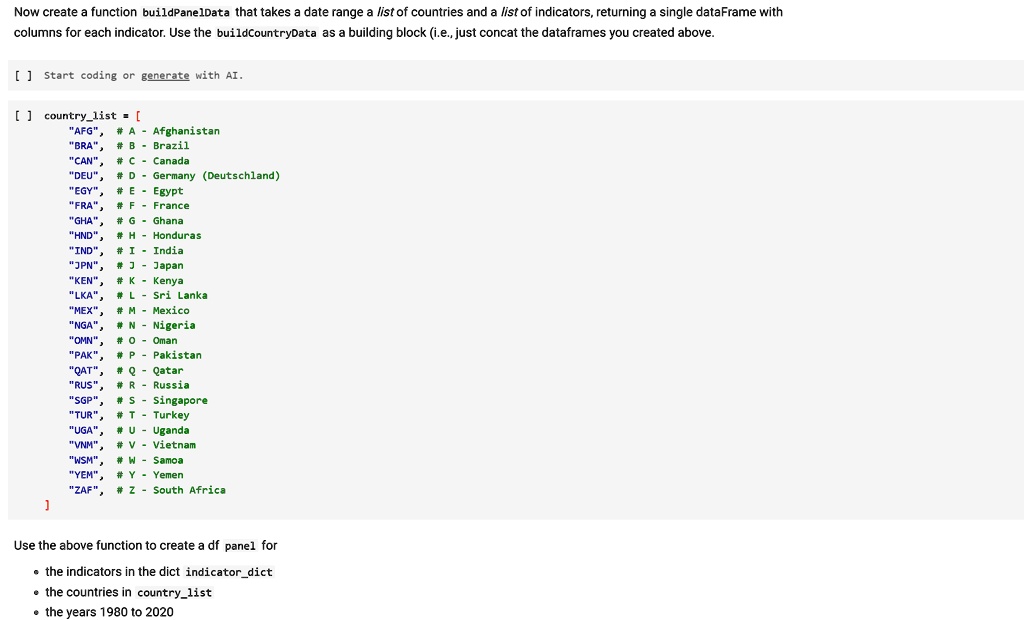
[] country_list = [
"AFG", #A - Afghanistan
"BRA", # B - Brazil
"CAN", # C - Canada
"DEU", # D - Germany (Deutschland)
"EGY", #E - Egypt
"FRA", # F - France
"GHA", # G - Ghana
"HND", #H - Honduras
"IND", # I - India
"JPN", #J - Japan
"KEN", #K - Kenya
"LKA", #L - Sri Lanka
"MEX", # M - Mexico
"NGA", #N - Nigeria
"OMN", #0 - Oman
"PAK", #P - Pakistan
"QAT", #Q - Qatar
"RUS", #R - Russia
"SGP", #S - Singapore
"TUR", #T - Turkey
"UGA", #U - Uganda
"VNM", # V - Vietnam
"WSM", # W - Samoa
"YEM", #Y - Yemen
"ZAF", # Z - South Africa
]
Use the above function to create a df panel for
• the indicators in the dict indicator_dict
• the countries in country_list
• the years 1980 to 2020