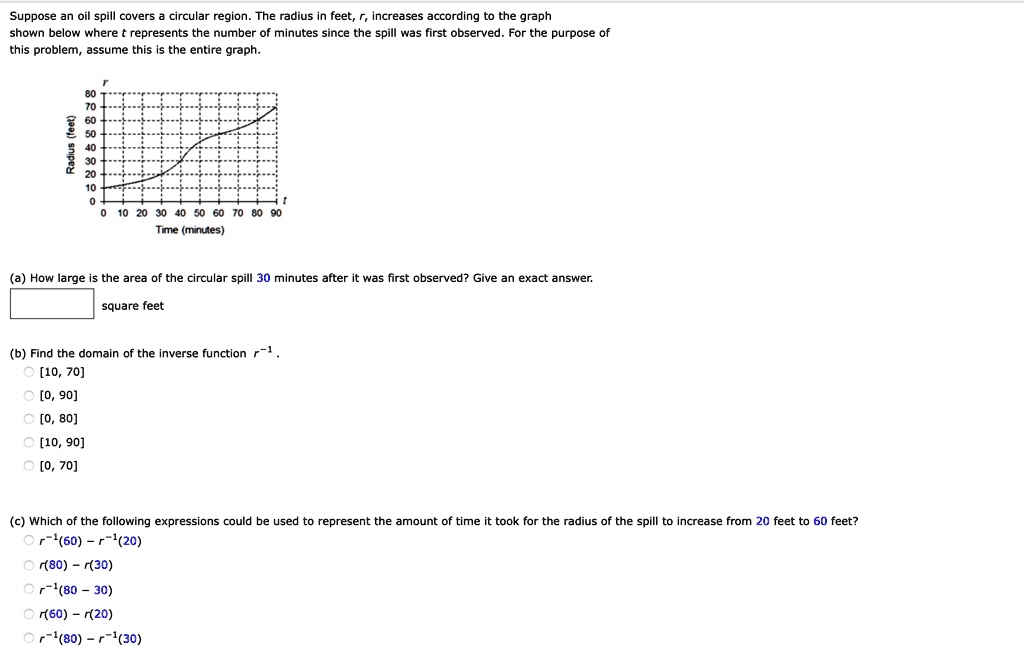
Suppose an oil spill covers a circular region. The radius in feet, r, increases according to the graph
shown below where t represents the number of minutes since the spill was first observed. For the purpose of
this problem, assume this is the entire graph.
(a) How large is the area of the circular spill 30 minutes after it was first observed? Give an exact answer.
square feet
(b) Find the domain of the inverse function r^(-1).
[10,70]
[0,90]
[0,80]
[10,90]
[0,70]
(c) Which of the following expressions could be used to represent the amount of time it took for the radius of the spill to increase from 20 feet to 60 feet?
r^(-1)(60)-r^(-1)(20)
r(80)-r(30)
r^(-1)(80-30)
r(60)-r(20)
r^(-1)(80)-r^(-1)(30)
Suppose an oil spill covers a circular region. The radius in feet, r, increases according to the graph shown below where t represents the number of minutes since the spill was first observed. For the purpose of this problem, assume this is the entire graph.
80 70 Radius (feet) 10 102030405060708090 Time (minutes)
(a) How large is the area of the circular spill 30 minutes after it was first observed? Give an exact answer.
square feet
(b) Find the domain of the inverse function r-1 O [10,70]
[06'0]
O[0,80]
O[10,90] O [0, 70]
(c) Which of the following expressions could be used to represent the amount of time it took for the radius of the spill to increase from 20 feet to 60 feet?
r(80-r(30 O r-180 - 30) r(60-r(20 0--08-O