Owing to attractive flavour \& nutritional characteristics (e.g., actively lowers LDL cholesterol \( { }^{[1] 1} \), aids blood pressure \& blood sugar regulation \( { }^{(22)} \), olive oil has long been vulnerable to fraud. \( { }^{[3]} \)
Despite the efforts of regulation agencies, like the International Olive Council (IOC) \( )^{[4]} \) or the USDA \( { }^{[5]]} \), olive oil remains especially susceptible to fraudulent adulteration. Adulteration can be either innocuous, passing off cheaper, inferior oils as authentic extra virgin olive oil (EVOO), or lethal if oil is contaminated with toxic chemicals. \( { }^{[6]} \)
Typical methods to determine adulteration in olive oil focus on gas or liquid chromatography-mass spectrometry (GC-MS or LC-MS). These methods can be time consuming - requiring extensive sample preparation and data interpretation. Although not commonly used in this context, NMR spectroscopy is an alternative technique that can provide useful information based on distinct chemical signatures within the proton NMR spectrum. The benefits of NMR include linear response factors, fast sample preparation and simple data analysis.
Oils are composed primarily of triglycerides with fatty acids chains, such as the unsaturated fatty acids shown here. Each type of olive oil will have an expected fatty acid composition.
\begin{tabular}{|c|c|c|}
\hline & & \[
\underset{\text { Sompertise }}{\text { St }}
\] \\
\hline \multirow{5}{*}{\[
\stackrel{\Delta a}{\mathrm{Ca}}
\]} & & \( 12 \times \) \\
\hline & Mwomeatunetive firy Mexti & H\% \\
\hline & & 425 \\
\hline & 4 mbu asion & *2 \\
\hline & Ons meturb & \\
\hline \multirow{5}{*}{\[
\begin{array}{c}
\text { Snvteon } \\
\text { Oif }
\end{array}
\]} & Siumsetiry mion & Hes \\
\hline & Mongmonaturet fity nels & 13\% \\
\hline & themenelor & \( { }^{7} \) \\
\hline & Lnose mealmet & * \\
\hline & & 3 \\
\hline
\end{tabular}
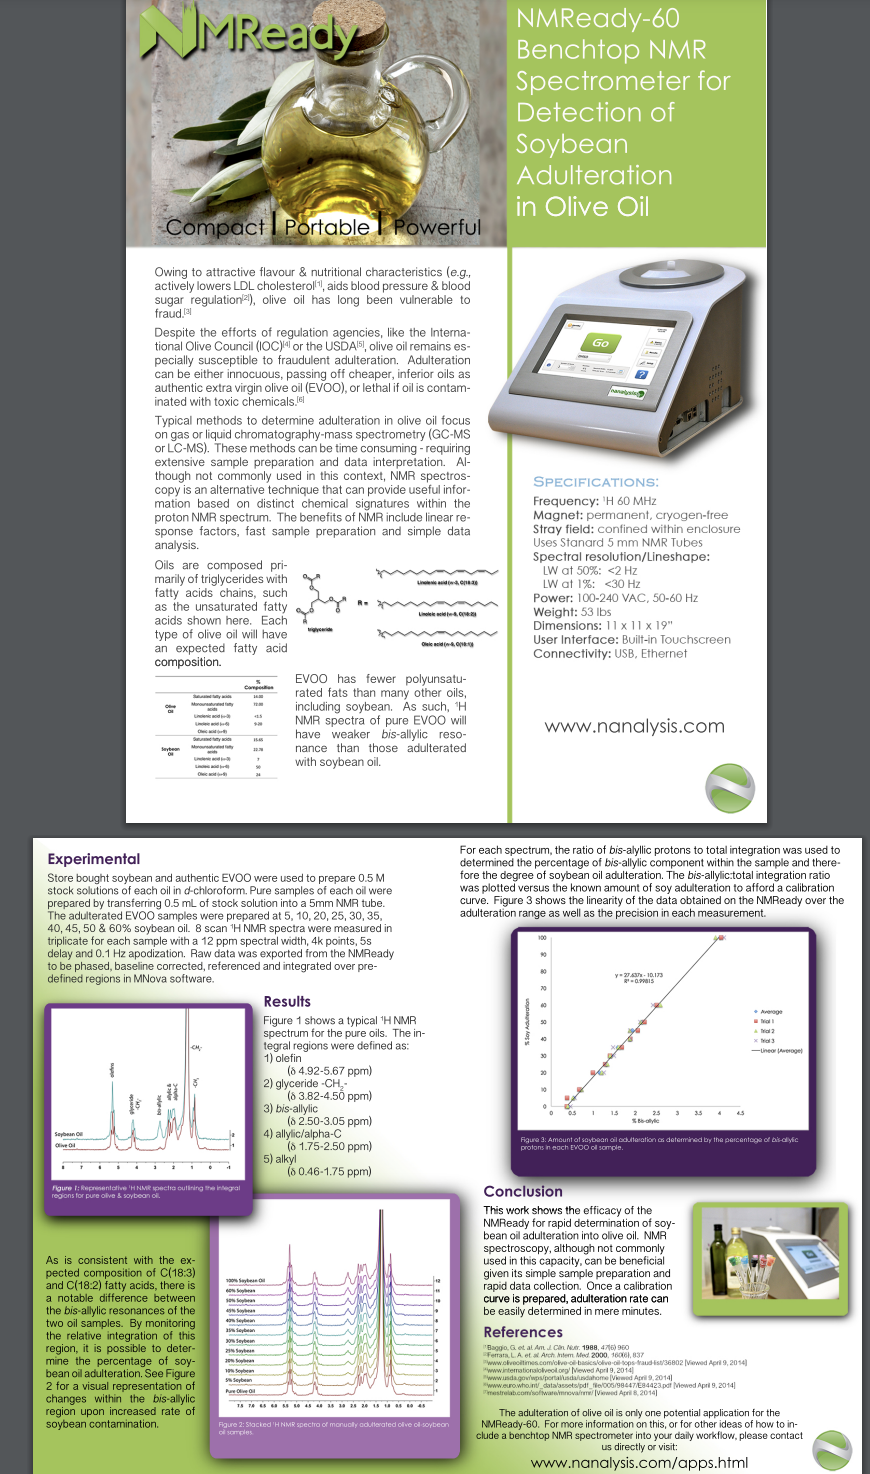
NMReady-60 Benchtop NMR Spectrometer for Detection of Soybean Adulteration in Olive Oil
SPECIFICATIONS:
Frequency: 'H 60 MHz Magnet: permanent, cryogen-free Stray field: confined within enclosure Uses Stanard 5 mm NMR Tubes Spectral resolution/Lineshape:
LW at \( 50 \% \) : \( <2 \mathrm{~Hz} \)
Power: \( 100-240 \) VAC, \( 50-60 \mathrm{~Hz} \) Weight: 53 lbs Dimensions: \( 11 \times 11 \times 19^{\prime \prime} \) User Interface: Built-in Touchscreen Connectivity: USB, Ethernet
EVOO has fewer polyunsaturated fats than many other oils, including soybean. As such, \( { }^{1} \mathrm{H} \) NMR spectra of pure EVOO will have weaker bis-allylic resonance than those adulterated with soybean oil.
www.nanalysis.com
Experimental
Store bought soybean and authentic EVOO were used to prepare 0.5 M stock solutions of each oil in \( d \)-chloroform. Pure samples of each oil were prepared by transferring 0.5 mL of stock solution into a 5 mm NMR tube. The adulterated EVOO samples were prepared at \( 5,10,20,25,30,35 \),
\( 40,45,50 \& 60 \% \) soybean oil. 8 scan \( { }^{1} \mathrm{H} \) NMR spectra were measured in triplicate for each sample with a 12 ppm spectral width, 4 k points, 5 s delay and 0.1 Hz apodization. Raw data was exported from the NMReady to be phased, baseline corrected, referenced and integrated over predefined regions in MNova software.
Results
Figure 1 shows a typical \( { }^{1} \) H NMR spectrum for the pure oils. The integral regions were defined as: 1) olefin
( \( \delta 4.92-5.67 \mathrm{ppm} \) )
2) glyceride \( -\mathrm{CH}_{2} \) -
( \( 83.82-4.50 \mathrm{ppm} \) )
3) bis-allylic
( \( \delta 2.50-3.05 \mathrm{ppm} \) )
4) allylic/alpha-C
( \( \delta 1.75-2.50 \mathrm{ppm} \) )
5) alkyl
( \( \delta 0.46-1.75 \mathrm{ppm} \) )
As is consistent with the expected composition of \( \mathrm{C}(18: 3) \) and \( \mathrm{C}(18: 2) \) fatty acids, there is a notable difference between
the bis-allylic resonances of the two oil samples. By monitoring the relative integration of this region, it is possible to determine the percentage of soy-
bean oil adulteration. See Figure 2 for a visual representation of changes within the bis-allylic region upon increased rate of soybean contamination.
For each spectrum, the ratio of bis-alyllic protons to total integration was used to determined the percentage of bis-allylic component within the sample and therefore the degree of soybean oil adulteration. The bis-allylic.total integration ratio
was plotted versus the known amount of soy adulteration to afford a calibration curve. Figure 3 shows the linearity of the data obtained on the NMReady over the adulteration range as well as the precision in each measurement.
Conclusion
This work shows the efficacy of the NMReady for rapid determination of soybean oil adulteration into olive oil. NMR spectroscopy, although not commonly given its simple sample preparation and rapid data collection. Once a calibration curve is prepared, adulteration rate can be easily determined in mere minutes.
References
The adulteration of olive oil is only one potential application for the NMReady-60. For more information on this, or for other ideas of how to include a benchtop NMR spectrometer into your daily worklow, please contact
us directly or visi:
WWW.nanalysis.com/apps.html www.nanalysis.com/apps.html