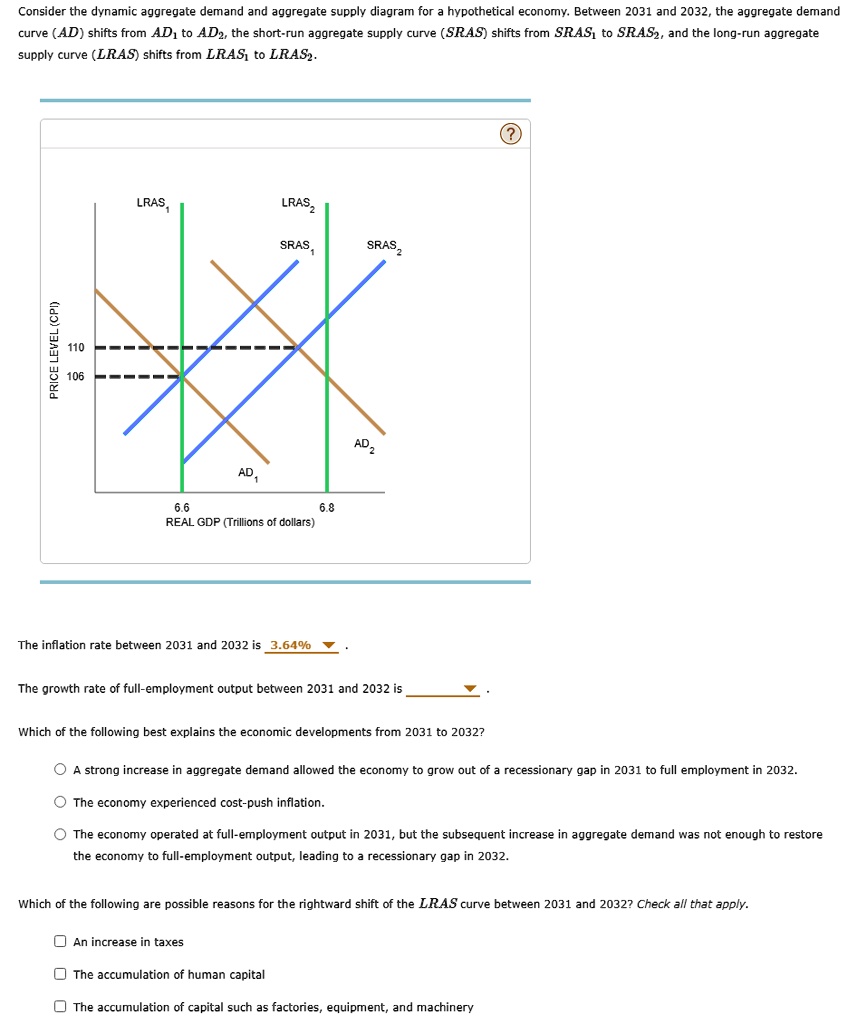
Consider the dynamic aggregate demand and aggregate supply diagram for a hypothetical economy. Between 2031 and 2032, the aggregate demand
curve (AD) shifts from AD? to AD?, the short-run aggregate supply curve (SRAS) shifts from SRAS? to SRAS?, and the long-run aggregate
supply curve (LRAS) shifts from LRAS? to LRAS?.
PRICE LEVEL (CPI)
110
106
LRAS?
LRAS?
SRAS?
SRAS?
6.6
AD?
REAL GDP (Trillions of dollars)
6.8
AD?
The inflation rate between 2031 and 2032 is 3.64%.
The growth rate of full-employment output between 2031 and 2032 is
Which of the following best explains the economic developments from 2031 to 2032?
A strong increase in aggregate demand allowed the economy to grow out of a recessionary gap in 2031 to full employment in 2032.
The economy experienced cost-push inflation.
The economy operated at full-employment output in 2031, but the subsequent increase in aggregate demand was not enough to restore
the economy to full-employment output, leading to a recessionary gap in 2032.
Which of the following are possible reasons for the rightward shift of the LRAS curve between 2031 and 2032? Check all that apply.
An increase in taxes
The accumulation of human capital
The accumulation of capital such as factories, equipment, and machinery