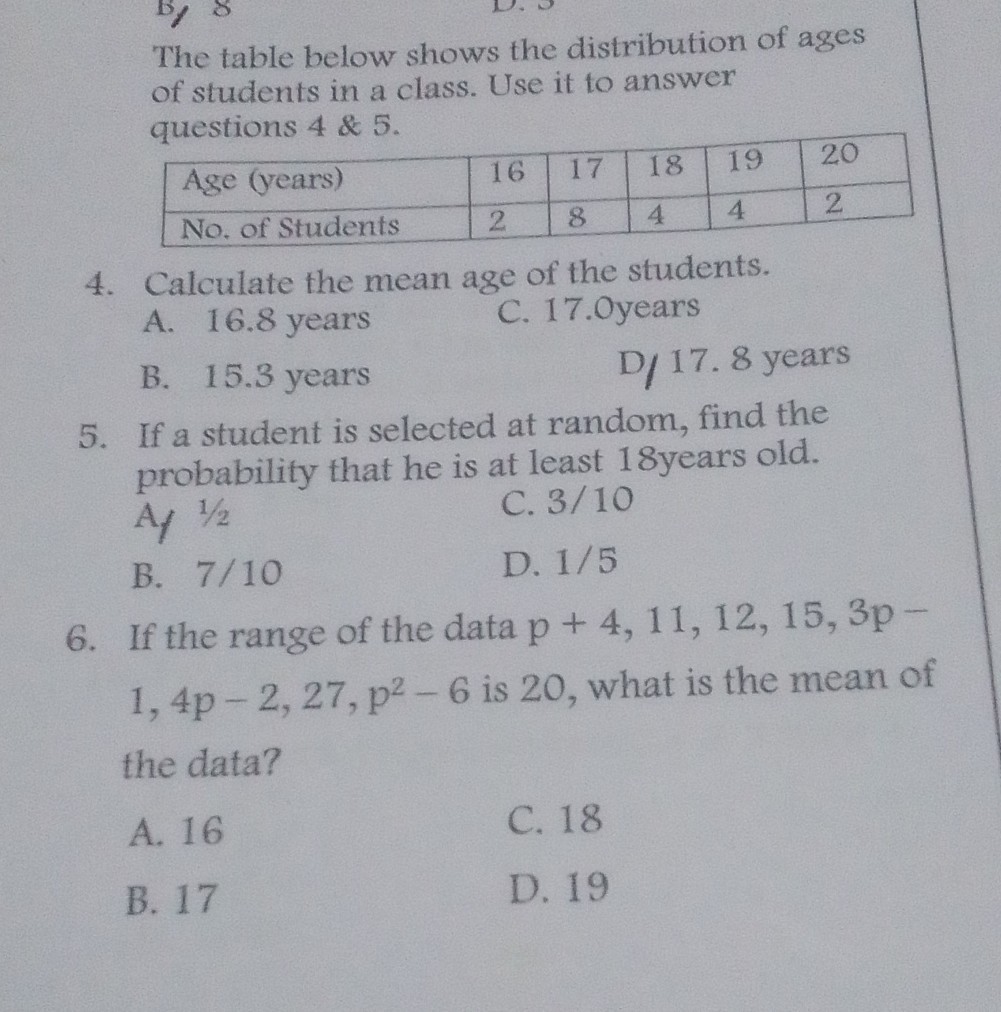
The table below shows the distribution of ages of students in a class. Use it to answer questions \( 4 \& 5 \).
\begin{tabular}{|l|l|l|l|l|l|}
\hline Age (years) & 16 & 17 & 18 & 19 & 20 \\
\hline No. of Students & 2 & 8 & 4 & 4 & 2 \\
\hline
\end{tabular}
4. Calculate the mean age of the students.
A. 16.8 years
C. 17.Oyears
B. 15.3 years
D/ 17.8 years
5. If a student is selected at random, find the probability that he is at least 18 years old.
Af \( 1 / 2 \)
C. \( 3 / 10 \)
B. \( 7 / 10 \)
D. \( 1 / 5 \)
6. If the range of the data \( p+4,11,12,15,3 p- \) \( 1,4 p-2,27, p^{2}-6 \) is 20 , what is the mean of the data?
A. 16
C. 18
B. 17
D. 19