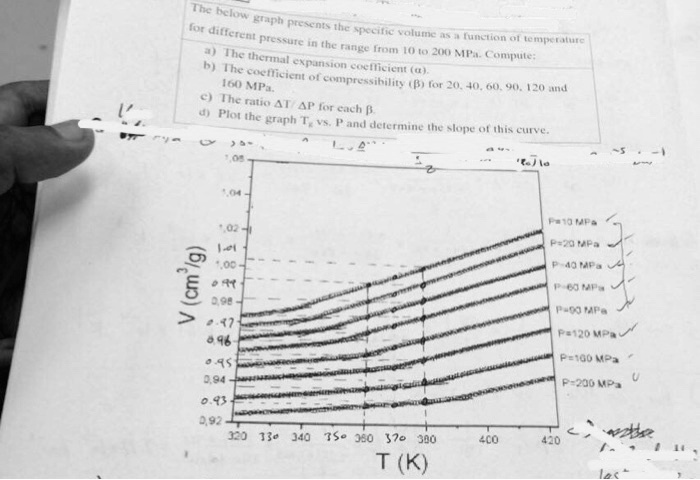
The below graph presents the specific volume as a function of temperature
for different pressure in the range from 10 to 200 MPa. Compute:
a) The thermal expansion coefficient ($\alpha$).
b) The coefficient of compressibility ($\beta$) for 20, 40, 60, 90, 120 and
160 MPa.
c) The ratio $\Delta T / \Delta P$ for each $\beta$.
d) Plot the graph $T_\beta$ vs. $P$ and determine the slope of this curve.