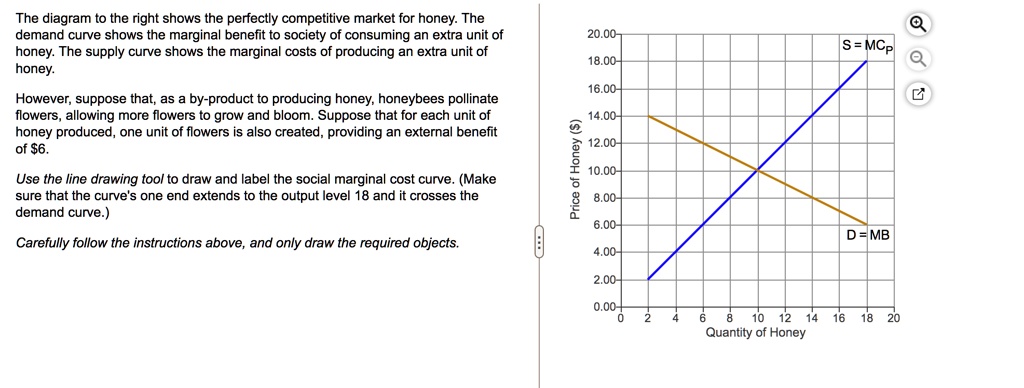
The diagram to the right shows the perfectly competitive market for honey. The
demand curve shows the marginal benefit to society of consuming an extra unit of
honey. The supply curve shows the marginal costs of producing an extra unit of
honey.
However, suppose that, as a by-product to producing honey, honeybees pollinate
flowers, allowing more flowers to grow and bloom. Suppose that for each unit of
honey produced, one unit of flowers is also created, providing an external benefit
of $6.
Use the line drawing tool to draw and label the social marginal cost curve. (Make
sure that the curve's one end extends to the output level 18 and it crosses the
demand curve.)
Carefully follow the instructions above, and only draw the required objects.
Price of Honey ($)
20.00-
S = MC$_P$
18.00-
16.00-
14.00-
12.00-
10.00-
8.00-
6.00-
4.00-
2.00-
0.00+
0 2 4 6 8 10 12 14 16 18 20
Quantity of Honey
D = MB