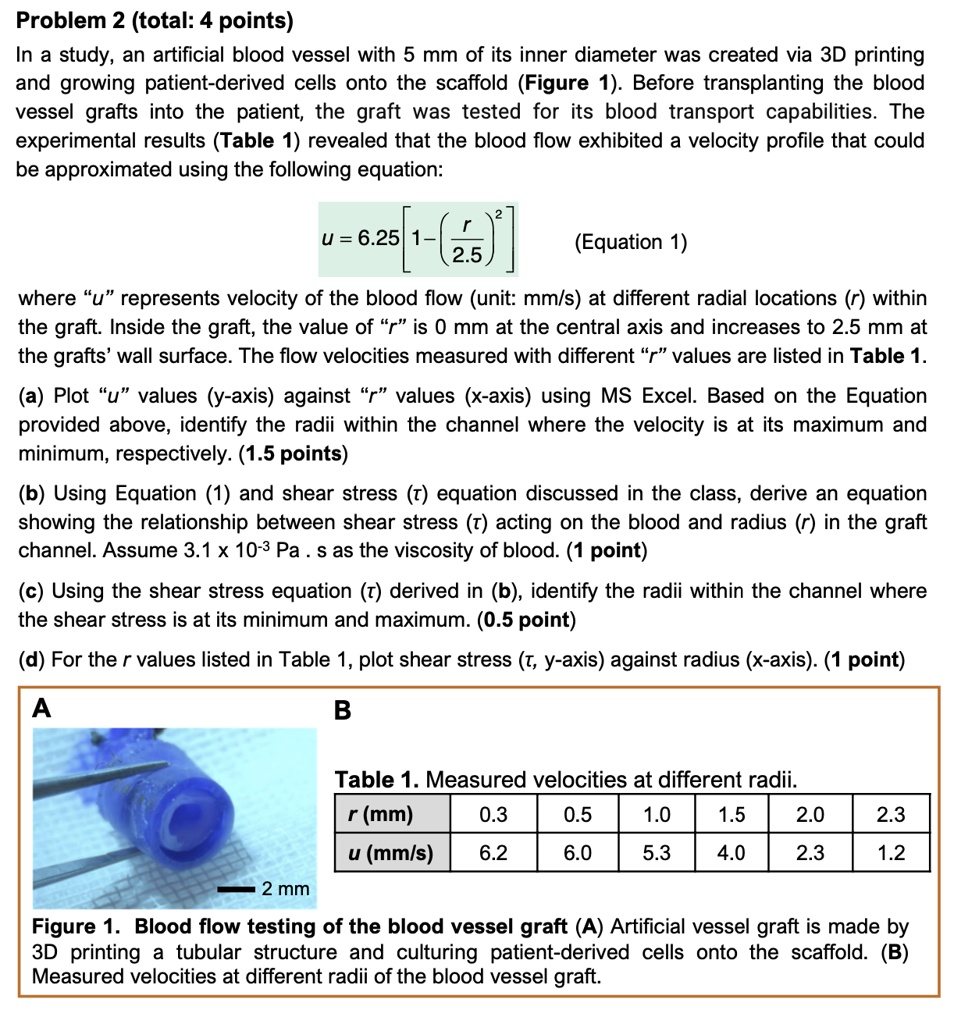
Problem 2 (total: 4 points) In a study, an artificial blood vessel with 5 mm of its inner diameter was created via 3D printing and growing patient-derived cells onto the scaffold (Figure 1). Before transplanting the blood vessel grafts into the patient, the graft was tested for its blood transport capabilities. The experimental results (Table 1) revealed that the blood flow exhibited a velocity profile that could be approximated using the following eguation:
U=6.25
(Equation 1)
where "u"represents velocity of the blood flow (unit: mm/s) at different radial locations (r) within
the graft. Inside the graft,the value of "r" is 0 mm at the central axis and increases to 2.5 mm at
(a) Plot "u" values (y-axis) against "r" values (x-axis) using MS Excel. Based on the Equation provided above, identify the radii within the channel where the velocity is at its maximum and minimum, respectively. (1.5 points)
(b) Using Equation (1) and shear stress (t) equation discussed in the class, derive an equation showing the relationship between shear stress () acting on the blood and radius (r) in the graft channel. Assume 3.1 x 10⁻³ Pa . s as the viscosity of blood. (1 point)
(c Using the shear stress eguation () derived in (b), identify the radii within the channel where
the shear stress is at its minimum and maximum. (0.5 point)
(d) For the r values listed in Table 1, plot shear stress (t, y-axis) against radius (x-axis). (1 point)
A
B
Table 1. Measured velocities at different radii
r (mm)
0.3
0.5
1.0
1.5
2.0
2.3
u (mm/s)
6.2
6.0
5.3
4.0
2.3
1.2
2 mm
Figure 1. Blood flow testing of the blood vessel graft (A) Artificial vessel graft is made by 3D printing a tubular structure and culturing patient-derived cells onto the scaffold. (B) Measured velocities at different radii of the blood vessel graft.