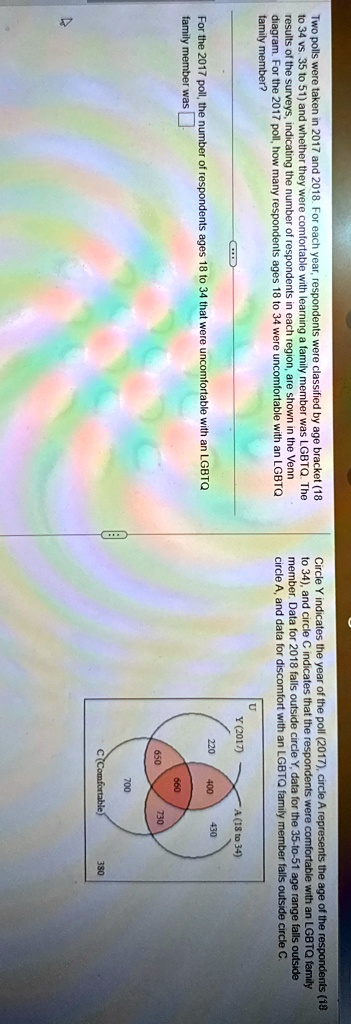
Two polls were taken in 2017 and 2018. For each year, respondents were classified by age bracket (18 to 34 vs. 35 to 51) and whether they were comfortable with learning a family member was LGBTQ. The results of the surveys, indicating the number of respondents in each region, are shown in the Venn diagram. For the 2017 poll, how many respondents ages 18 to 34 were uncomfortable with an LGBTQ family member?
Circle Y indicates the year of the poll (2017), circle A represents the age of the respondents (18 to 34), and circle C indicates that the respondents were comfortable with an LGBTQ family member. Data for 2018 falls outside circle Y, data for the 35-to-51 age range falls outside circle A, and data for discomfort with an LGBTQ family member falls outside circle C.
For the 2017 poll, the number of respondents ages 18 to 34 that were uncomfortable with an LGBTQ family member was