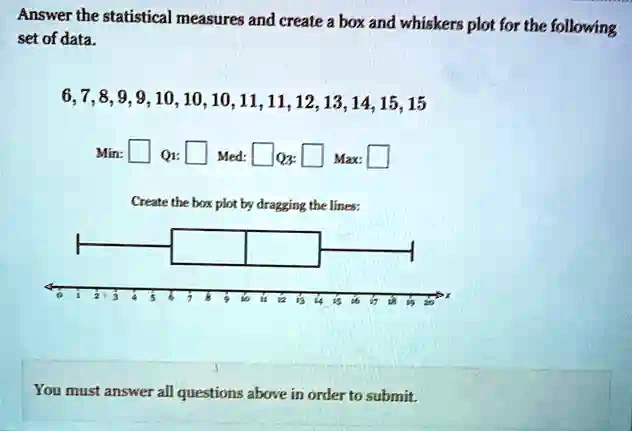
Answer the statistical measures and create a box and whiskers plot for the following
set of data.
6, 7, 8, 9, 9, 10, 10, 10, 11, 11, 12, 13, 14, 15, 15
Min:
Q1:
Med:
Q3:
Max:
Create the box plot by dragging the lines:
You must answer all questions above in order to submit.