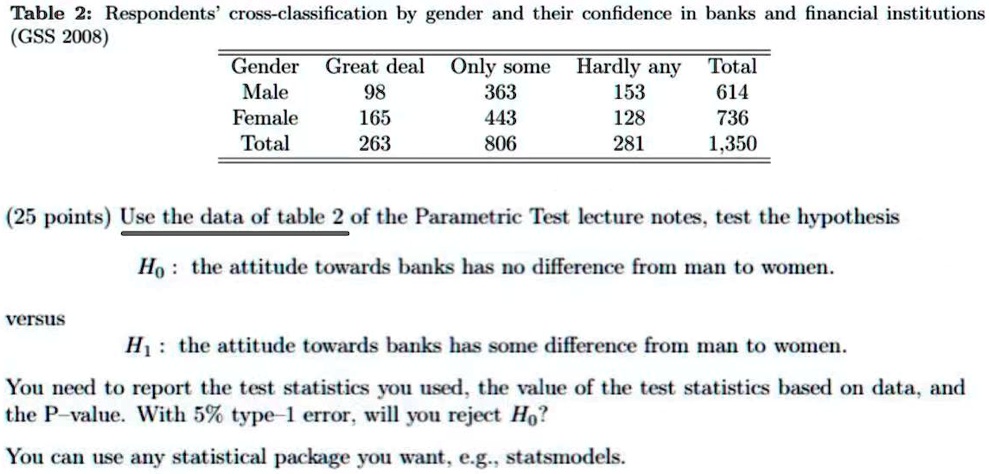
Table 2: Respondents' cross-classification by gender and their confidence in banks and financial institutions
(GSS 2008)
Gender Great deal Only some Hardly any Total
Male 98 363 153 614
Female 165 443 128 736
Total 263 806 281 1,350
(25 points) Use the data of table 2 of the Parametric Test lecture notes, test the hypothesis
$H_0$: the attitude towards banks has no difference from man to women.
versus
$H_1$: the attitude towards banks has some difference from man to women.
You need to report the test statistics you used, the value of the test statistics based on data, and
the P-value. With 5% type-1 error, will you reject $H_0$?
You can use any statistical package you want, e.g., statsmodels.