7. Figure: Water Works
Price,
Costs,
Marginal
Revenue
21
20
18
16
14
13
12
11
10
9
8
7
6
5
4
2
0
MR
ATC
MC
Reference: Ref 29-4
50 100 150 200 250 300 350 400
375
Quantity (number of customers)
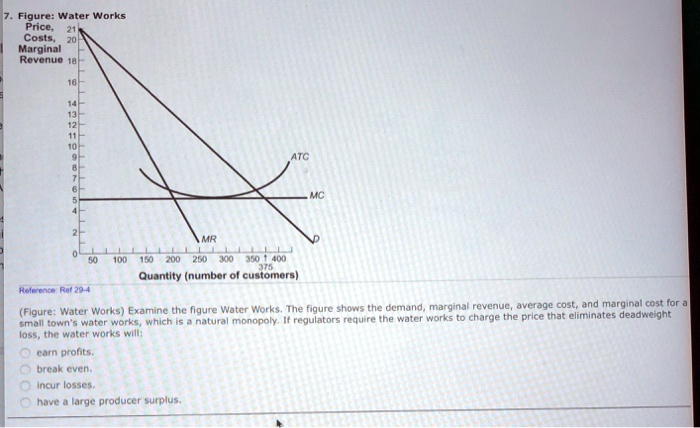
(Figure: Water Works) Examine the figure Water Works. The figure shows the demand, marginal revenue, average cost, and marginal cost for a
small town's water works, which is a natural monopoly. If regulators require the water works to charge the price that eliminates deadweight
loss, the water works will:
earn profits.
break even.
incur losses.
have a large producer surplus.