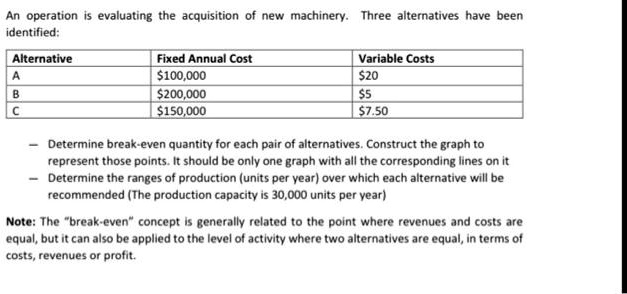
An operation is evaluating the acquisition of new machinery. Three alternatives have been
identified:
Alternative Fixed Annual Cost Variable Costs
A $100,000 $20
B $200,000 $5
C $150,000 $7.50
\textendash Determine break-even quantity for each pair of alternatives. Construct the graph to
represent those points. It should be only one graph with all the corresponding lines on it
\textendash Determine the ranges of production (units per year) over which each alternative will be
recommended (The production capacity is 30,000 units per year)
Note: The \textquotedbl{}break-even\textquotedbl{} concept is generally related to the point where revenues and costs are
equal, but it can also be applied to the level of activity where two alternatives are equal, in terms of
costs, revenues or profit.