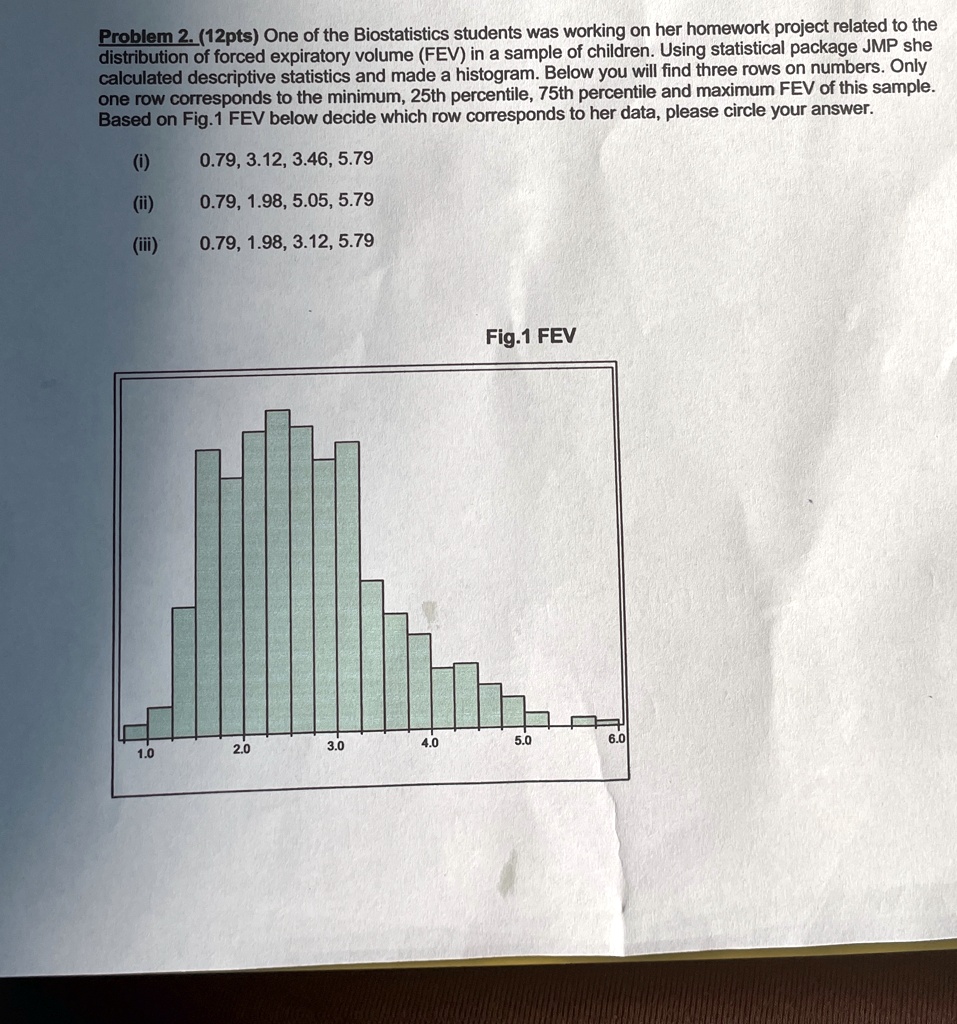
Problem 2. (12pts) One of the Biostatistics students was working on her homework project related to the
distribution of forced expiratory volume (FEV) in a sample of children. Using statistical package JMP she
calculated descriptive statistics and made a histogram. Below you will find three rows on numbers. Only
one row corresponds to the minimum, 25th percentile, 75th percentile and maximum FEV of this sample.
Based on Fig.1 FEV below decide which row corresponds to her data, please circle your answer.
(i)
0.79, 3.12, 3.46, 5.79
(ii)
0.79, 1.98, 5.05, 5.79
(iii)
0.79, 1.98, 3.12, 5.79
Fig.1 FEV
1.0
2.0
3.0
4.0
5.0
6.0