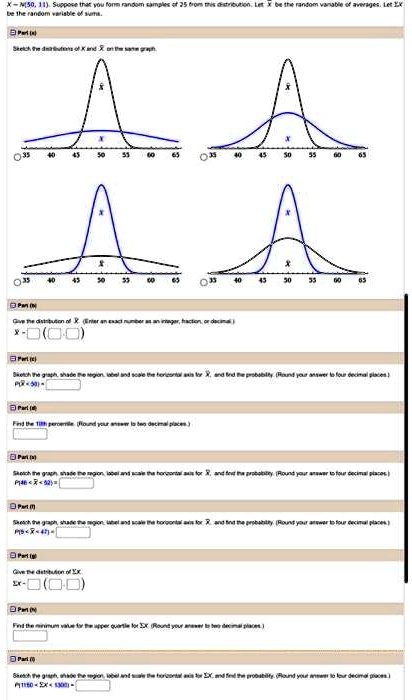
X ~ N(50, 11). Suppose that you form random samples of 25 from this distribution. Let $\bar{X}$ be the random variable of averages. Let $\sum X$ be the random variable of sums.
Sketch the distributions of $\bar{X}$ and $\sum X$ on the same graph.
Give the distribution of $\bar{X}$. (Enter an exact number as an integer, fraction, or decimal.)
$\bar{X}$ ~ ( , )
Sketch the graph, shade the region, label and scale the horizontal axis for $\bar{X}$, and find the probability. (Round your answer to four decimal places.)
P($\bar{X}$ ? 52) =
Find the 10th percentile. (Round your answer to two decimal places.)
Sketch the graph, shade the region, label and scale the horizontal axis for $\bar{X}$, and find the probability. (Round your answer to four decimal places.)
P(46 < $\bar{X}$ < 52) =
Sketch the graph, shade the region, label and scale the horizontal axis for $\bar{X}$, and find the probability. (Round your answer to four decimal places.)
P($\bar{X}$ < 47) =
Give the distribution of $\sum X$.
$\sum X$ ~ ( , )
Find the minimum value for the upper quartile for $\sum X$. (Round your answer to two decimal places.)
Sketch the graph, shade the region, label and scale the horizontal axis for $\sum X$, and find the probability. (Round your answer to four decimal places.)
P(1150 ? $\sum X$ ? 1300) =