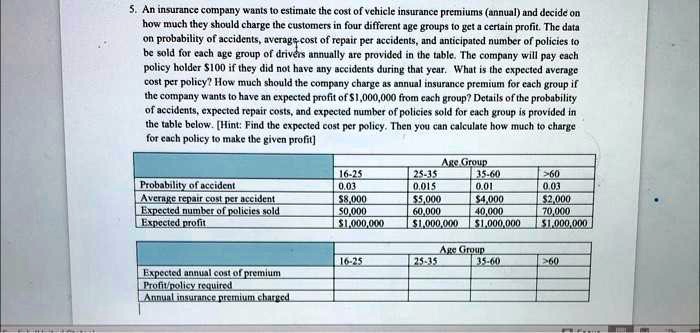
5. An insurance company wants to estimate the cost of vehicle insurance premiums (annual) and decide on
how much they should charge the customers in four different age groups to get a certain profit. The data
on probability of accidents, averags-cost of repair per accidents, and anticipated number of policies to
be sold for each age group of drivers annually are provided in the table. The company will pay each
policy holder $100 if they did not have any accidents during that year. What is the expected average
cost per policy? How much should the company charge as annual insurance premium for each group if
the company wants to have an expected profit of $1,000,000 from each group? Details of the probability
of accidents, expected repair costs, and expected number of policies sold for each group is provided in
the table below. [Hint: Find the expected cost per policy. Then you can calculate how much to charge
for each policy to make the given profit]
Probability of accident
Average repair cost per accident
Expected number of policies sold
Expected profit
Expected annual cost of premium
Profit/policy required
Annual insurance premium charged
Age Group
16-25
25-35
35-60
>60
0.03
0.015
0.01
0.03
$8,000
$5,000
$4,000
$2,000
50,000
60,000
40,000
70,000
$1,000,000
$1,000,000
$1,000,000
$1,000,000
Age Group
16-25
25-35
35-60
>60