5. The market for loanable funds and government policy
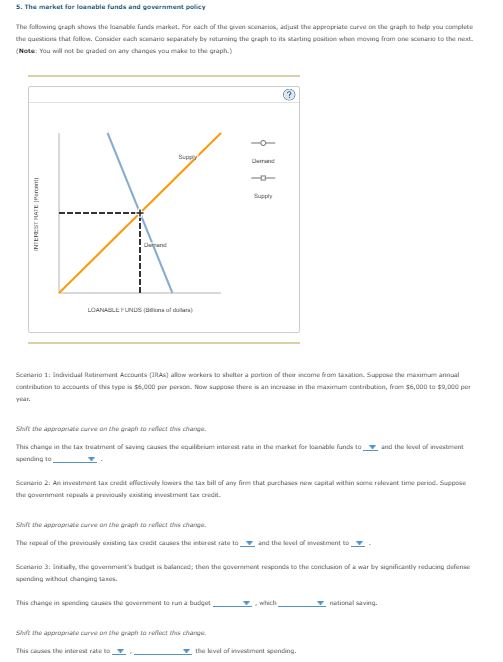
The following graph shows the loanable funds market. For each of the given scenarios, adjust the appropriate curve on the graph to help you complete the questions that follow. Consider each scenario separately by returning the graph to its starting position when moving from one scenario to the next. (Note: You will not be graded on any changes you make to the graph.)
Scenario 1: Individual Retirement Accounts (IRAs) allow workers to shelter a portion of their income from taxation. Suppose the maximum annual contribution to accounts of this type is $6,000 per person. Now suppose there is an increase in the maximum contribution, from $6,000 to $9,000 per year.
Shift the appropriate curve on the graph to reflect this change.
This change in the tax treatment of saving causes the equilibrium interest rate in the market for loanable funds to ____ and the level of investment spending to ____.
Scenario 2: An investment tax credit effectively lowers the tax bill of any firm that purchases new capital within some relevant time period. Suppose the government repeals a previously existing investment tax credit.
Shift the appropriate curve on the graph to reflect this change.
The repeal of the previously existing tax credit causes the interest rate to ____ and the level of investment to ____.
Scenario 3: Initially, the government's budget is balanced; then the government responds to the conclusion of a war by significantly reducing defense spending without changing taxes.
This change in spending causes the government to run a budget ____, which ____ national saving.
Shift the appropriate curve on the graph to reflect this change.
This causes the interest rate to ____, ____ the level of investment spending.