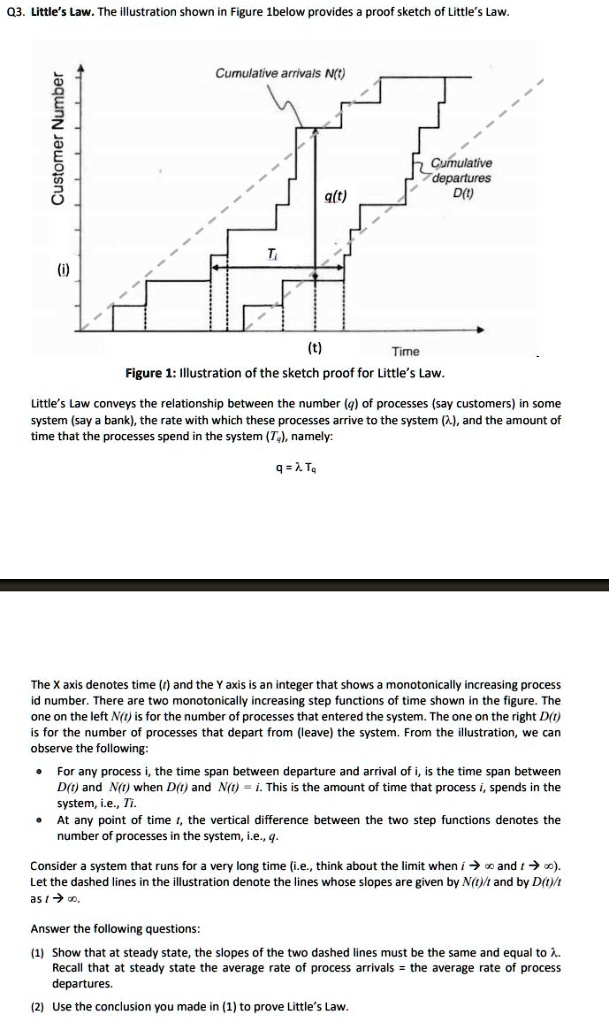
Q3. Little's Law. The illustration shown in Figure 1below provides a proof sketch of Little's Law.
Customer Number
(i)
Cumulative arrivals N(t)
T
q(t)
Cumulative
departures
D(t)
(t)
Time
Figure 1: Illustration of the sketch proof for Little's Law.
Little's Law conveys the relationship between the number (q) of processes (say customers) in some
system (say a bank), the rate with which these processes arrive to the system (?.), and the amount of
time that the processes spend in the system (T), namely:
q = ?. Tq
The X axis denotes time (1) and the Y axis is an integer that shows a monotonically increasing process
id number. There are two monotonically increasing step functions of time shown in the figure. The
one on the left N(t) is for the number of processes that entered the system. The one on the right D(t)
is for the number of processes that depart from (leave) the system. From the illustration, we can
observe the following:
• For any process i, the time span between departure and arrival of i, is the time span between
D(t) and N(t) when D(t) and N(t)=i. This is the amount of time that process i, spends in the
system, i.e., Ti.
• At any point of time t, the vertical difference between the two step functions denotes the
number of processes in the system, i.e., q.
Consider a system that runs for a very long time (i.e., think about the limit when i?? and t?).
Let the dashed lines in the illustration denote the lines whose slopes are given by N(t)/t and by D(t)/t
as100.
Answer the following questions:
(1) Show that at steady state, the slopes of the two dashed lines must be the same and equal to ?.
Recall that at steady state the average rate of process arrivals = the average rate of process
departures.
(2) Use the conclusion you made in (1) to prove Little's Law.