c. If significant differences exist across the machines, use Tukey's HSD method at the 5% significance level to determine which machines have different average output rates. (If the exact value for n_(T)-c is not found in the table, use the average of corresponding upper & lower studentized range values. Negative values should be indicated by a minus sign. Round your answers to 2 decimal places.)
able[[ able[[Population Mean],[Differences]],Confidence Interval, able[[Does The Average],[Differ?]]],[mu _(A)-mu _(B),[,-24.57,276.94,No],[mu _(A)-mu _(C),[,10.43,311.94,Yes],[mu _(A)-mu _(D),I,-160.94,114.27,No],[mu _(B)-mu _(C),[,-102.60,172.60,No],[mu _(B)-mu _(D),I,-300.27,打,Yes],[mu _(C)-mu _(D),[,-335.27,-25.06,Yes]]
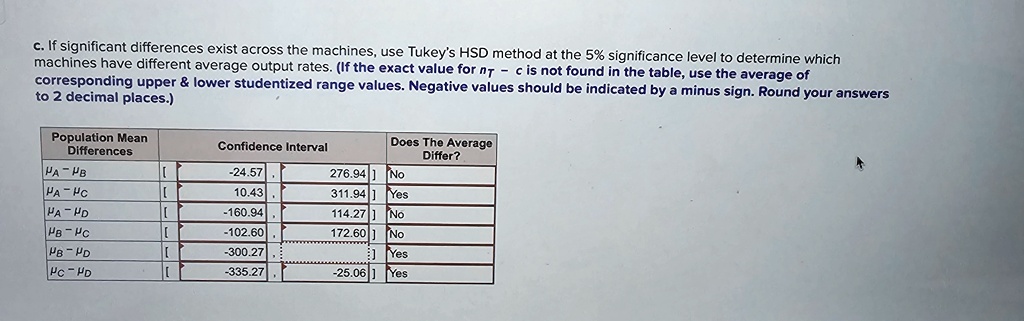
c.If significant differences exist across the machines,use Tukey's HSD method at the 5% significance level to determine which machines have different average output rates.If the exact value for nt - c is not found in the table,use the average of to 2 decimal places.) corresponding upper & lower studentized range values. Negative values should be indicated by a minus sign. Round your answers
Population Mean Differences PA-PB PA-HC HA-HD B-C PB-PD PC-PD
Confidence Interval Does The Average Differ? -24.57 276.94 No 10.43 311.94 Yes -160.94 114.27 No -102.60 172.60|] No -300.27 Yes 335.27 -25.06[] Yes