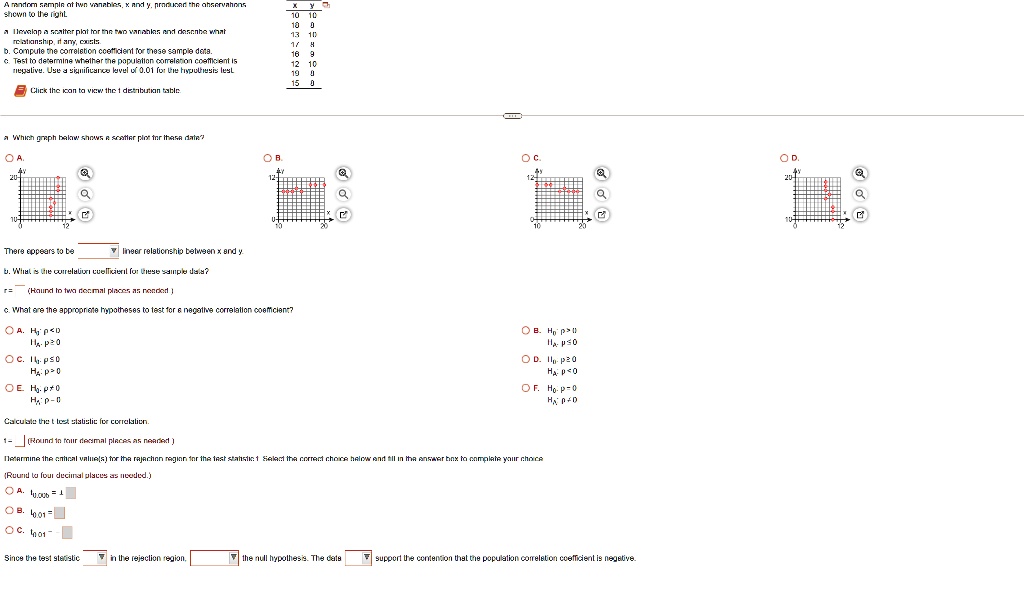
A random sample of two variables, $x$ and $y$, produced the observations shown to the right.
a. Develop a scatter plot for the two variables, and describe what relationship, if any, exists.
b. Compute the correlation coefficient for these sample data.
c. Test to determine whether the population correlation coefficient is negative. Use a significance level of 0.01 for the hypothesis test.
Click the icon to view the $t$ distribution table.
a. Which graph below shows a scatter plot for these data?
There appears to be \boxed{a linear} relationship between $x$ and $y$.
b. What is the correlation coefficient for these sample data?
$r = \boxed{-0.97}$ (Round to two decimal places as needed.)
c. What are the appropriate hypotheses to test for a negative correlation coefficient?
$\boxed{H_0: \rho \ge 0}$
$\boxed{H_a: \rho < 0}$
Calculate the $t$ test statistic for correlation.
$t = \boxed{-5.6642}$ (Round to four decimal places as needed.)
Determine the critical value(s) for the rejection region for the test statistic $t$. Select the correct choice below and fill in the answer box to complete your choice.
(Round to four decimal places as needed.)
$\boxed{-2.7638}$
Since the test statistic $\boxed{-5.6642}$ is in the rejection region, $\boxed{reject}$ the null hypothesis. The data $\boxed{support}$ the contention that the population correlation coefficient is negative.