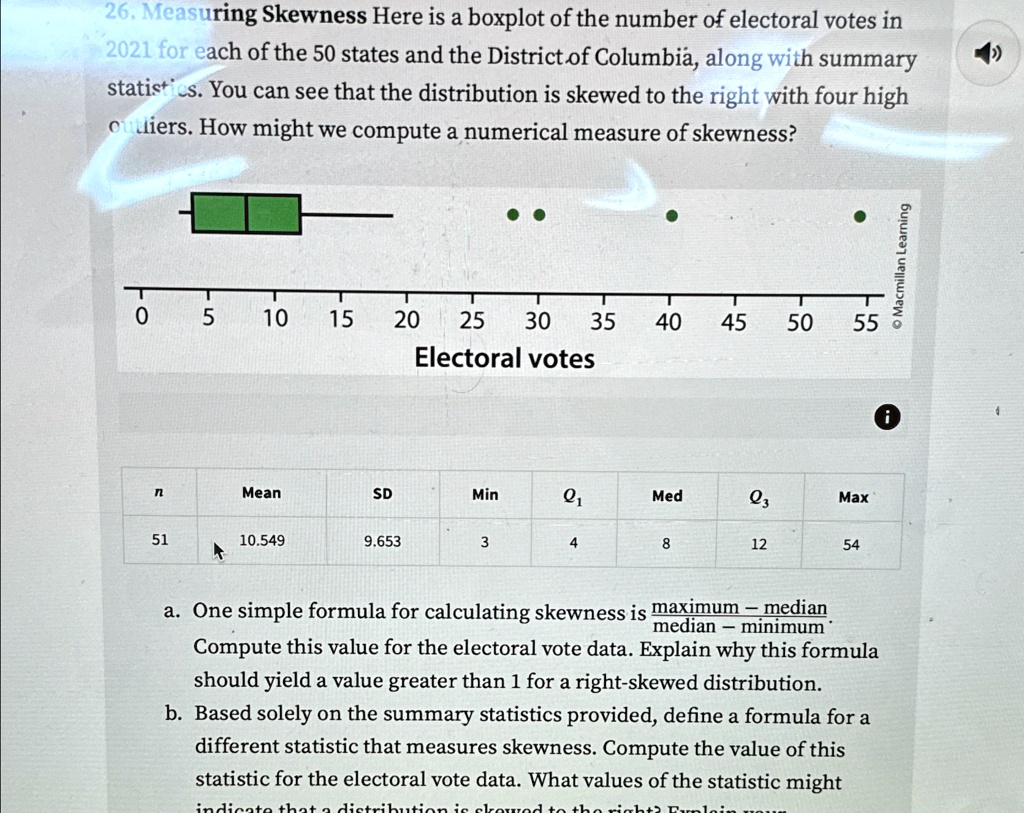
26. Measuring Skewness Here is a boxplot of the number of electoral votes in
2021 for each of the 50 states and the District of Columbia, along with summary
statistics. You can see that the distribution is skewed to the right with four high
outliers. How might we compute a numerical measure of skewness?
\\
0
5
10
15
20
25
30
35
40
45
50
55
Electoral votes
n
Mean
SD
Min
$Q_1$
Med
$Q_3$
Max
51
10.549
9.653
3
4
8
12
54
a. One simple formula for calculating skewness is $\frac{maximum - median}{median - minimum}$
Compute this value for the electoral vote data. Explain why this formula
should yield a value greater than 1 for a right-skewed distribution.
b. Based solely on the summary statistics provided, define a formula for a
different statistic that measures skewness. Compute the value of this
statistic for the electoral vote data. What values of the statistic might
indicate that a distribution is skewed to the right? Explain your