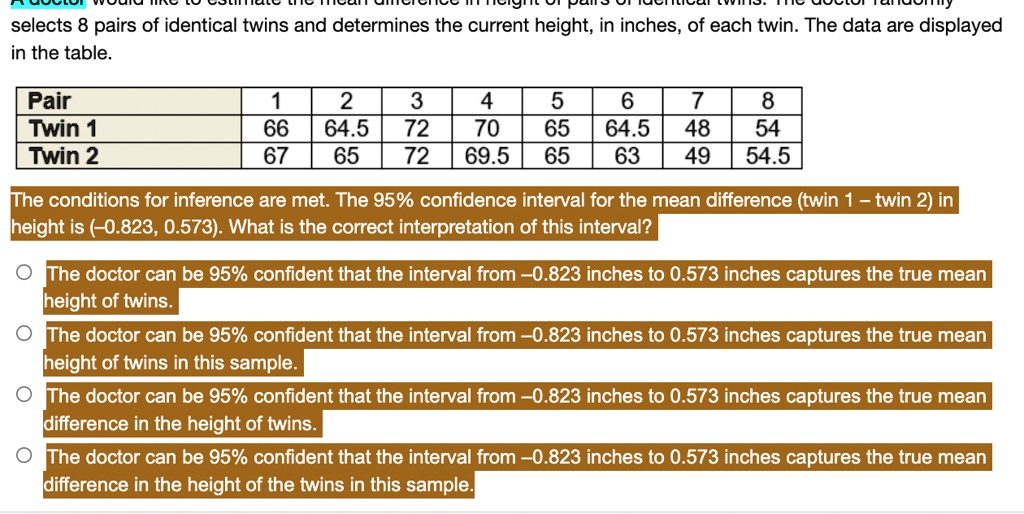
A doctor would like to estimate the mean difference in height of pairs of identical twins. The doctor randomly selects 8 pairs of identical twins and determines the current height, in inches, of each twin. The data are displayed in the table.
Pair: 1, 2, 3, 4, 5, 6, 7, 8
Twin 1: 66, 64.5, 72, 70, 65, 64.5, 48, 54
Twin 2: 67, 65, 72, 69.5, 65, 63, 49, 54.5
The conditions for inference are met. The 95% confidence interval for the mean difference (twin 1 – twin 2) in height is (-0.823, 0.573). What is the correct interpretation of this interval?
- The doctor can be 95% confident that the interval from -0.823 inches to 0.573 inches captures the true mean height of twins.
- The doctor can be 95% confident that the interval from -0.823 inches to 0.573 inches captures the true mean height of twins in this sample.
- The doctor can be 95% confident that the interval from -0.823 inches to 0.573 inches captures the true mean difference in the height of twins.
- The doctor can be 95% confident that the interval from -0.823 inches to 0.573 inches captures the true mean difference in the height of the twins in this sample.